Acid-Base Titrations

Requires a Wolfram Notebook System
Interact on desktop, mobile and cloud with the free Wolfram Player or other Wolfram Language products.
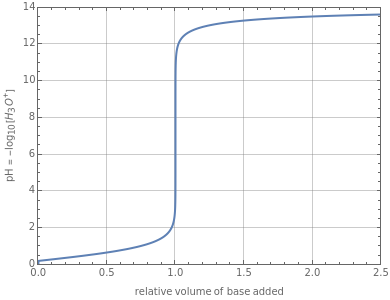
This Demonstration simulates the titration of an acid with a strong base, such as NaOH. As base in the pipette is added to the acid in the beaker, the  of the solution is monitored by a
  meter or by use of an indicator. The strength of the acid is determined by the acid dissociation (or ionization) constant
  , more conveniently expressed as
  . For a strong acid,
  (or negative). A number of weak acids, for example acetic acid, have
  in the neighborhood of 5. A diprotic acid, such as
  or
or  , is characterized by two acid constants
  and
and  that pertain to successive ionizations producing the two hydrogen ions. For simplicity, the initial concentrations of the acid and base are assumed to be equal. Thus a diprotic acid requires twice the volume of base for neutralization.
Contributed by: S. M. Blinder (March 2011)
Open content licensed under CC BY-NC-SA
Snapshots
Details
Snapshot 1: titration curve for strong acid-strong base neutralization
Snapshot 2: titration curve for diprotic acid
Snapshot 3: buffer region for weak acid with 
Reference: P. W. Atkins and Julio de Paula, Atkins' Physical Chemistry, 8th ed., New York: Oxford University Press, 2006 pp. 240–245.
Permanent Citation


