Anscombe Quartet

Requires a Wolfram Notebook System
Interact on desktop, mobile and cloud with the free Wolfram Player or other Wolfram Language products.
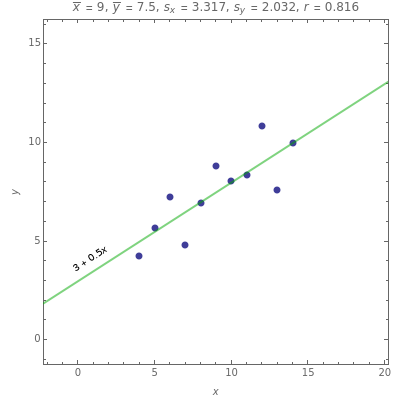
The Anscombe quartet is comprised of four scatterplots that have nearly identical correlations, as well as means and standard deviations, but disparate shapes. These graphs show the crucial role that data visualization plays in developing a sensible statistical model. The negative option is included to produce the mirror image graph.
Contributed by: Ian McLeod (University of Western Ontario) (April 2010)
Open content licensed under CC BY-NC-SA
Snapshots
Details
This Demonstration is intended for introductory statistics courses.
[1] F. J. Anscombe, "Graphs in Statistical Analysis," The American Statistician 27(1), 1973 pp. 17–21.
[2] "Anscombe's Quartet," Wikipedia.
Permanent Citation
"Anscombe Quartet"
http://demonstrations.wolfram.com/AnscombeQuartet/
Wolfram Demonstrations Project
Published: April 26 2010


