Applications of Driving-Force and McCabe-Thiele Diagrams to Binary Distillation Processes


Requires a Wolfram Notebook System
Interact on desktop, mobile and cloud with the free Wolfram Player or other Wolfram Language products.
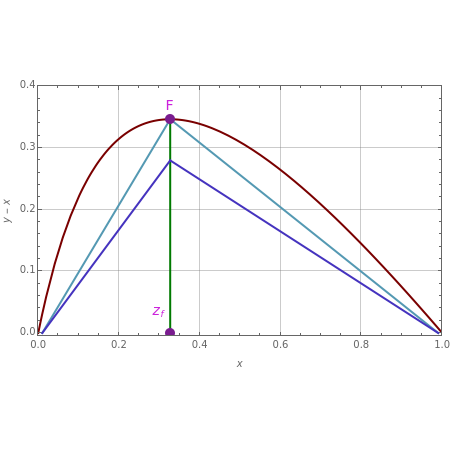
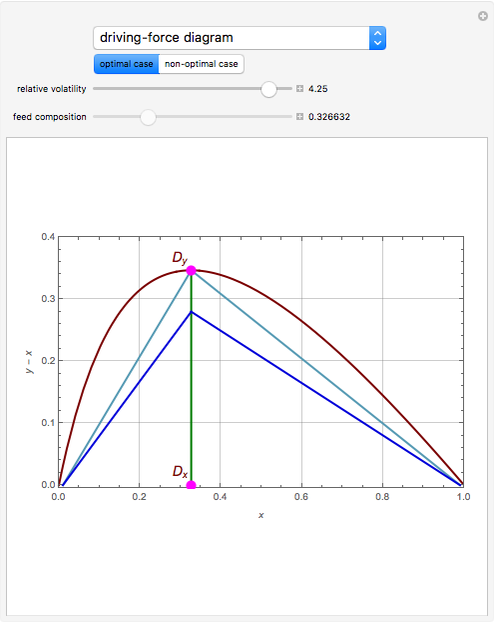
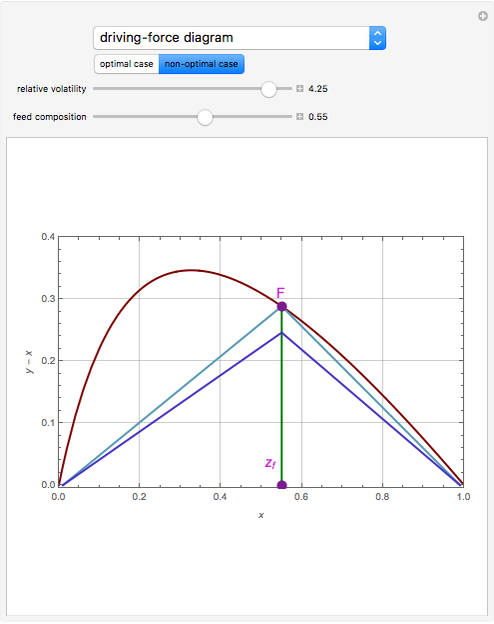
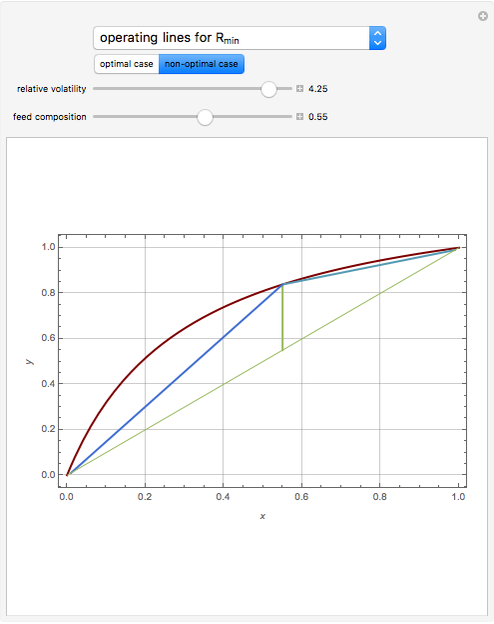
The driving-force diagram for a constant relative volatility binary mixture is obtained by plotting  versus
  , where and
  are the liquid and vapor mole fractions of the light component. Explicitly, the driving force is
 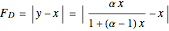 , where
  is the relative volatility.


Contributed by: Housam Binous (March 2011)
(Kind Fahd University Petroleum & Minerals)
Open content licensed under CC BY-NC-SA
Snapshots

Details
References
[1] R. Gani and E. Bek–Pedersen, "Simple New Algorithm for Distillation Column Design," AIChE Journal, 46(6), 2000 pp. 1271–1274.
[2] E. Bek–Pedersen, R. Gani, and O. Levaux, "Determination of Optimal Energy Efficient Separation Schemes Based on Driving Forces," Computers and Chemical Engineering, 24(2–7), 2000 pp. 253–259.
[3] E. Bek–Pedersen and R. Gani, "Design and Synthesis of Distillation Systems Using a Driving-Force-Based Approach," Chemical Engineering and Processing, 43(3), 2004 pp. 251–262.
[4] W. L. McCabe and E. W. Thiele, "Graphical Design of Fractionating Columns," Industrial and Engineering Chemistry 17(6), 1925 pp. 605–611.
Permanent Citation
 Binary Distillation of Non-Ideal Mixtures Using Driving-Force Diagrams
Housam Binous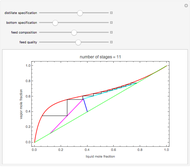 McCabe-Thiele Graphical Method for a Non-Ideal Binary Mixture
Housam Binous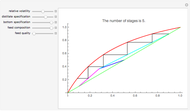 McCabe & Thiele Graphical Method
Housam Binous McCabe-Thiele Method for Methanol/Water Separation
Neil Hendren and Rachael L. Baumann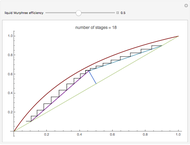 Application of the Murphree Liquid Efficiency Method to the Study of a Binary Distillation Column
Housam Binous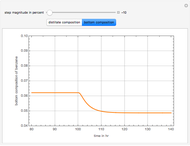 Dynamic Simulation of a Binary Distillation Column
Housam Binous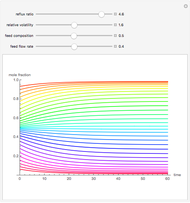 Dynamics of a Binary Distillation Column
Housam Binous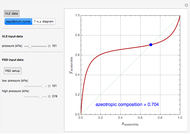 Separating Binary Azeotropes Using Pressure Swing Distillation
Housam Binous and Brian G. Higgins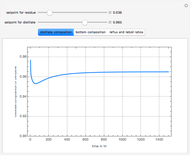 Dual Product Control of a Binary Distillation Column
Housam Binous, Naim Faqir, and Eid Al-Mutairi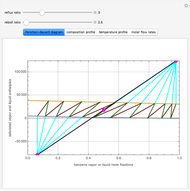 Simulation of a Steady-State Binary Distillation Column
Housam Binous
-
 Liquid-Liquid Equilibrium for the 1-Butanol-Water System
Housam Binous -
 Temperature Dependence of Dehydrogenation of Ethyl Benzene to Styrene
Housam Binous -
 Deconvolution of a Chromatogram
Housam Binous -
 Distribution of Colloidal Particles during Solvent Evaporation
Housam Binous -
 Heat Conduction in a Rod
Housam Binous -
 Optimal Setup of Two Continuous Stirred-Tank Reactors (CSTRs) in Series
Housam Binous -
 Study of the Dynamic Behavior of the Lorenz System
Housam Binous -
 A Graphically Enhanced Method for Computing Real Roots of Nonlinear Functions
Housam Binous -
 Design of a Shell and Tube Heat Exchanger
Housam Binous -
 Correction Factor for Shell and Tube Heat Exchanger
Housam Binous -
 Contour Plots for Reaction Rates
Housam Binous -
 Optimal Conditions for CO2/n-Hexane Flash Separation
Housam Binous -
 Residual Functions for the SRK and PR Equations of State
Housam Binous -
 Gas-Phase Fugacity Coefficients for Propylene
Housam Binous -
 Operation of a Throttling Valve
Housam Binous -
 Joule-Thomson Inversion Curves for Soave-Redlich-Kwong (SRK) and Peng-Robinson (PR) Equations of State
Housam Binous -
 Lee-Kesler Generalized Correlations for Gases
Housam Binous -
 Mapping the Maxima for a Nonisothermal Chemical System
Housam Binous -
 Operation of an Air Conditioner
Housam Binous -
 Adiabatic Mixing of Two Moist Air Streams
Housam Binous