Assessing the Risk of Food Poisoning


Requires a Wolfram Notebook System
Interact on desktop, mobile and cloud with the free Wolfram Player or other Wolfram Language products.
The probability of becoming sick or dying after ingesting a food-borne pathogen’s cells primarily depends on its virulence, the number of cells ingested, and the state of the person’s health. A dose-response-based model that incorporates the pathogen’s infective or lethal dose, its cells’ exponential growth rate, the growth duration, and an additive factor that represents an individual’s susceptibility or immunity is used to estimate this probability. Since the magnitudes of these factors are rarely if ever known exactly, they are entered as ranges. The acute poisoning probability is estimated by the expanded Fermi solution method, where random values formed within these ranges are used to calculate interim estimates in hundreds of Monte Carlo runs. The mode of the histogram of these interim estimates is considered the best estimate of the probability of poisoning.
Contributed by: Mark D. Normand and Micha Peleg (June 2014)
Open content licensed under CC BY-NC-SA
Snapshots
Details
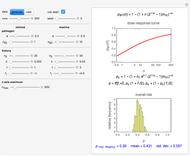
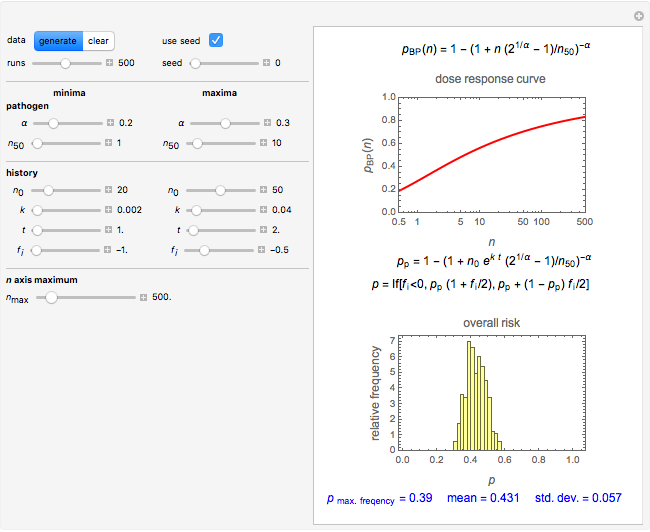
Snapshot 1: a highly virulent organism after a short period of growth in a healthy person
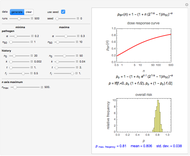
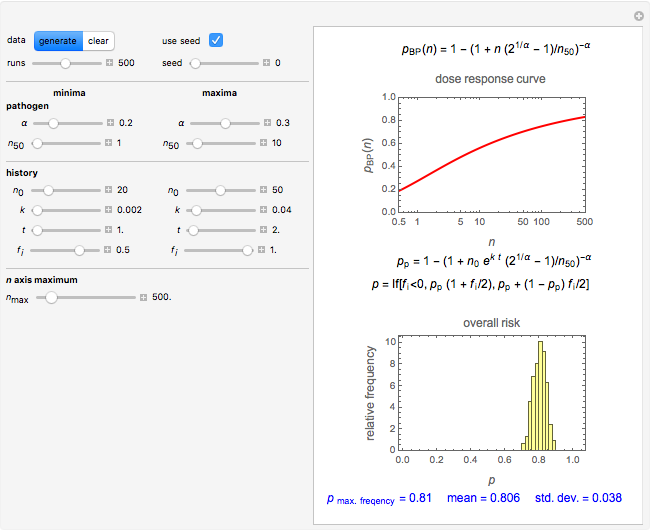
Snapshot 2: a highly virulent organism after a short period of growth in a person having a compromised immune system
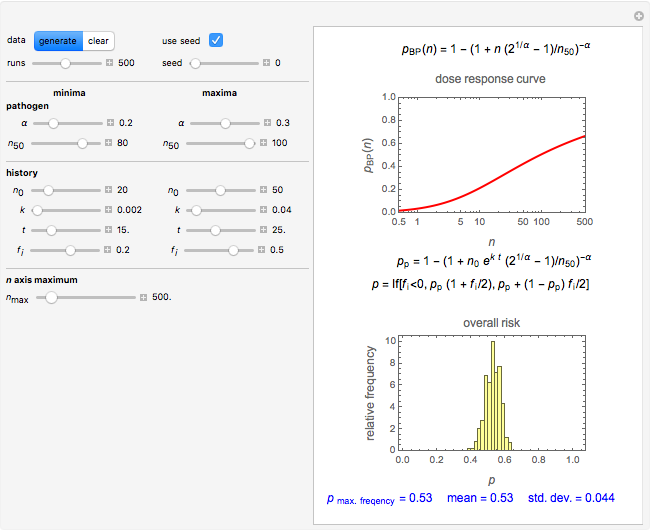
Snapshot 3: a milder virulent organism after a short period of growth in a person having a compromised immune system
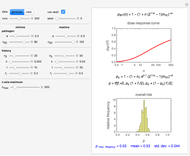
Snapshot 4: a milder virulent organism after a long period of growth in a healthy person
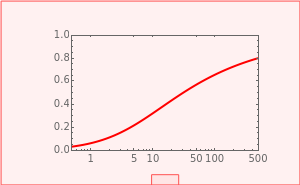
This Demonstration presents an expanded Fermi solution method [1, 2] to estimate the probability of becoming sick or dying as a result of consuming food contaminated with a pathogenic bacterium. The method is based on a modified version of the beta-Poisson model of dose-response curves [3] where the "dose" (the number of ingested cells) is replaced by an exponential growth term to account for the pathogen’s ability to multiply in the food before its ingestion.
The pathogen's dose-response curve, which is displayed at the top, is a modified version of the beta-Poisson model [4]: 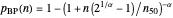 , where
  is the probability of being poisoned by ingesting
  cells,
  the number that will result in 50% infection, and
  the pathogen's characteristic constant.
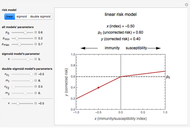
The combined model has two components: one  determined by the organism's dose-response curve and number of cells actually ingested, and the other determined by
  , (
, ( ), a parameter that accounts for the individual’s susceptibility or resistance to infection. The first component has the form:
  , where
  is the initial number of cells,
  the growth time (e.g. in hours or days) starting from incomplete cooking, for example, and
  a characteristic exponential growth rate constant in the corresponding units. Where
  (indicating susceptibility), the poisoning probability rises, and where
  (indicating resistance), it is lowered. According to the combined model, the food poisoning probability
  is given by the following: if
  , then
 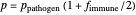 and otherwise
  .
.
Since  ,
,  ,
,  ,
,  ,
,  , and
, and  are rarely if ever known exactly, they are identified by the upper and lower limits of their probable ranges, set by sliders. Random parameter values from within their respective ranges are then used to compute
  estimates repeatedly using the above equation as a model. The actual number of runs is selected with a slider and so is the seed, if desired. The histogram of these interim estimates is calculated and displayed. The interim value having the highest frequency is considered the best estimate of poisoning probability for the entered parameter settings. Its numerical value is displayed in blue accompanied by the histogram’s mean and standard deviation.
The main objective of the Demonstration is to illustrate the expanded Fermi solution method’s potential use in calculating the probability of sickness or death as a result of food poisoning. Since it has not been intended to estimate the risk of any particular pathogen, not all the parameter combinations that the Demonstration allows necessarily have a real-life counterpart.
References
[1] M. Peleg, M. D. Normand, J. Horowitz, and M. G. Corradini, "Expanded Fermi Solution for Estimating the Survival of Ingested Pathogenic and Probiotic Microbial Cells and Spores," Applied and Environmental Microbiology, 77, 2011 pp. 312–319.
[2] M. Peleg, M. D. Normand, and M. G. Corradini, "Construction of Food and Water Borne Pathogens' Dose-Response Curves Using the Expanded Fermi Solution," Journal of Food Science, 76, 2011 pp. R82–R89.
[3] D. L. Holcomb, M. A. Smith, G. O. Ware, Y.-C. Hung, R. E. Brackett, and M. P. Doyle, "Comparison of Six Dose-Response Models for Use with Food-Borne Pathogens," Risk Analysis, 19(6), 1999 pp. 1091–1099.
[4] "Dose Response Assessment." Quantitative Microbial Risk Assessment (QMRA) Wiki. (Jan 16, 2013) qmrawiki.msu.edu/index.php?title=Dose_response_assessment.
Permanent Citation
 Effect of Immunity and Susceptibility on Sickness or Mortality Risk
Mark D. Normand and Micha Peleg Food Calories
Mark D. Normand and Micha Peleg Food Color Comparisons
Mark D. Normand and Micha Peleg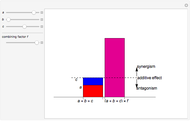 Food Preservation Hurdle Technology
Mark D. Normand and Micha Peleg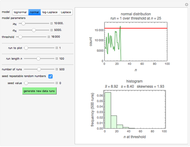 Estimation of Time to Excessive Microbial Count
Mark D. Normand and Micha Peleg Three Component Food Mixtures
Christina S. Barsa, Mark D. Normand and Micha Peleg Titration of Common Food Acids
Amy D. Kim, Mark D. Normand, and Micha Peleg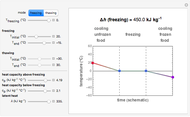 Heat Balance in Freezing and Thawing Food
Mark D. Normand and Micha Peleg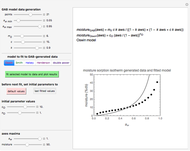 Comparison of Food Moisture Sorption Isotherm Equations
Mark D. Normand and Micha Peleg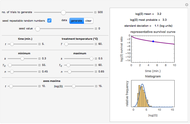 Uncertainties in Isothermal Microbial Inactivation
Mark D. Normand and Micha Peleg
-
 Gordon-Taylor and Fox Equations for Glass Transition Temperature
Micha Peleg -
 Force to Overcome Vacuum Pull
Micha Peleg -
 Extending the Square Root Growth Rate Model to Lethal Low Temperatures
Micha Peleg -
 Probability of Being Strange According to Paulos
Micha Peleg -
 Successive Three-Point Method for Weibullian Chemical Degradation
Micha Peleg -
 Estimating Cohesion and Tensile Strength of Compacted Powders
Micha Peleg -
 Three-Endpoints Method for Isothermal Weibullian Chemical Degradation
Micha Peleg -
 Vitamin C Loss in Foods During Heat Processing and Storage
Micha Peleg -
 Parameterizing Temperature-Viscosity Relations
Micha Peleg -
 Laplace Distribution in Fluctuating Stock Index Records
Micha Peleg -
 Weibullian Chemical Degradation
Micha Peleg -
 Simulating Ascorbic Acid Degradation
Micha Peleg -
 Additive and Multiplicative Risks
Micha Peleg -
 Endpoints Method for Predicting Chemical Degradation in Frozen Foods
Micha Peleg -
 Exponential Model for Arrhenius Activation Energy
Micha Peleg -
 Prediction of Isothermal Degradation by the Endpoints Method
Micha Peleg -
 Risk Guesstimation from Factor Ranges
Micha Peleg -
 Volatiles Formation Kinetics in Stored Fish
Micha Peleg -
 Comparison of Six Sigmoid Growth Curve Models
Micha Peleg -
Titration of Common Food Acids
Micha Peleg