Bell Curves

Requires a Wolfram Notebook System
Interact on desktop, mobile and cloud with the free Wolfram Player or other Wolfram Language products.
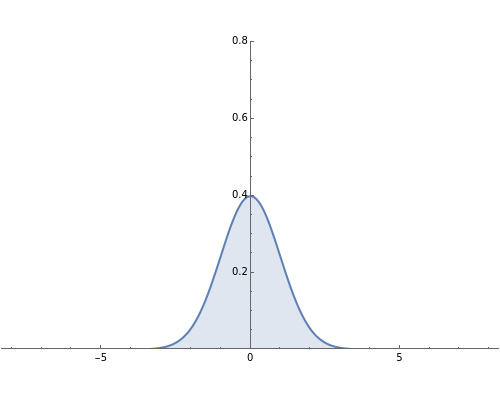
The distribution of many quantities has the form of a bell curve, and the distribution of averages of random samples is, under mild conditions, increasingly well approximated by a bell curve as the size of the samples increases. Mathematically, the bell curves are a family of curves, each member specified by two parameters: the mean, which controls the location of the hump of the curve, and the standard deviation, which controls whether the bell is broad and flat (larger standard deviation) or narrow and tall (smaller standard deviation). If the bell curve represents the distribution of some measurement across a population, the mean is the population average and the standard deviation measures how spread out the population measurements are.
Contributed by: Chris Boucher (March 2011)
Open content licensed under CC BY-NC-SA
Snapshots
Details
detailSectionParagraphPermanent Citation
"Bell Curves"
http://demonstrations.wolfram.com/BellCurves/
Wolfram Demonstrations Project
Published: March 7 2011


