Calculation of Diagnostic Accuracy Measures


Requires a Wolfram Notebook System
Interact on desktop, mobile and cloud with the free Wolfram Player or other Wolfram Language products.
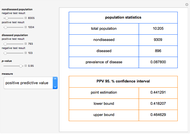
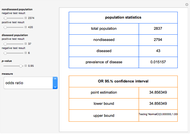
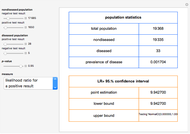
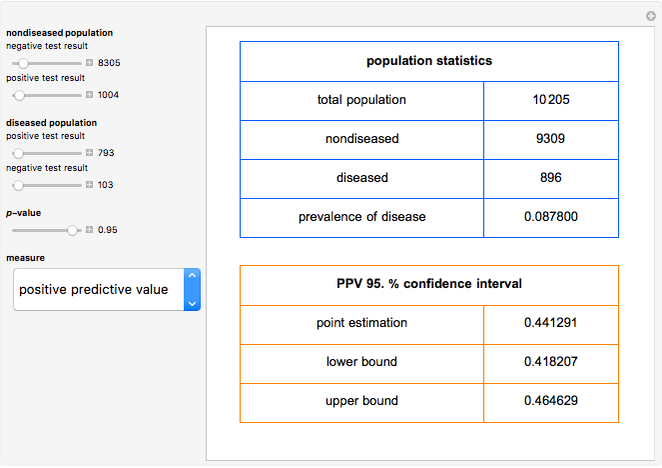
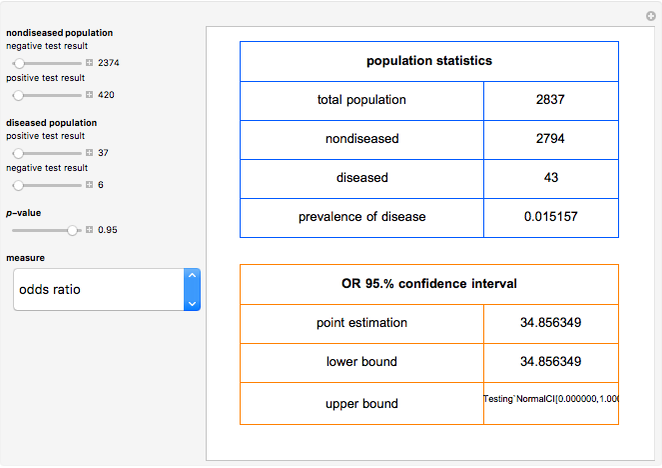
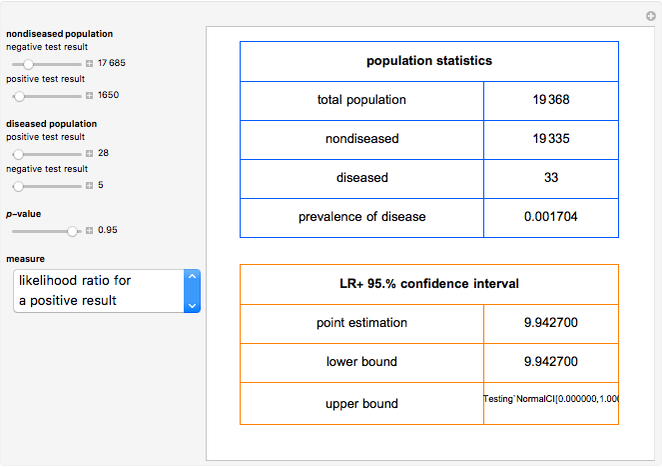
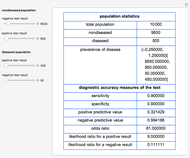
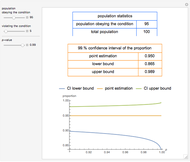
This Demonstration shows calculations of point estimations and confidence intervals for various accuracy measures of a diagnostic test for a disease. This is done for differing negative and positive test results of nondiseased and diseased populations and differing  -values for the estimations of the lower and upper bounds of the confidence intervals. The calculated measures are the sensitivity, the specificity, the positive predictive value (PPV), the negative predictive value (NPV), the (diagnostic) odds ratio (OR), the likelihood ratio for a positive test result (LR+) and the likelihood ratio for a negative test result (LR−). The measures can be selected using the menu. The negative and positive test results of the nondiseased and diseased populations, along with the -value, are chosen using the sliders.
Contributed by: Theodora Chatzimichail and Aristides T. Hatjimihail (June 2018)
(Hellenic Complex Systems Laboratory)
Open content licensed under CC BY-NC-SA
Snapshots
Details
Sensitivity refers to the fraction of the diseased population with a positive test result, while specificity is the fraction of the nondiseased population with a negative test result. Positive predictive value is the fraction of the population with a positive test result that is diseased, while negative predictive value is the fraction of the population with a negative test result that is not diseased. Prevalence of the disease is the ratio of the diseased population to the total (nondiseased and diseased) population. If we denote by  the sensitivity,
  the specificity and
  the prevalence, we have:
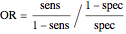 ,
,
 ,
,
 .
.
The Wilson score method with continuity correction is used [1] for calculating the confidence intervals of the sensitivity, the specificity, the positive predictive value and the negative predictive value.
For the calculation of the confidence intervals of the (diagnostic) odds ratio, the likelihood ratio for a positive test result and the likelihood ratio for a negative test result, it is assumed that their natural logarithms have asymptotically normal distributions [1].
This Demonstration is an extension of another Demonstration [2] and is appropriate as an educational and research tool.
References
[1] J. L. Fleiss, B. Levin and M. C. Paik, Statistical Methods for Rates and Proportions, 3rd ed., Hoboken, NJ: J. Wiley, 2003.
[2] T. Chatzimichaill, "Calculator for Diagnostic Accuracy Measures" from the Wolfram Demonstrations Project—A Wolfram Web Resource. demonstrations.wolfram.com/CalculatorForDiagnosticAccuracyMeasures.
Permanent Citation
 Calculator for Diagnostic Accuracy Measures
Theodora Chatzimichail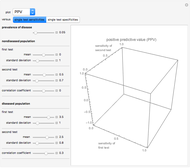 Analysis of Diagnostic Accuracy Measures for Two Combined Diagnostic Tests
Theodora Chatzimichail and Aristides T. Hatjimihail (Aristeidis T. Chatzimichail)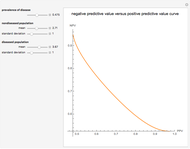 Correlation of Positive and Negative Predictive Values of Diagnostic Tests
Theodora Chatzimichail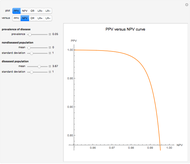 Relation of Diagnostic Accuracy Measures
Theodora Chatzimichail and Aristides T. Hatjimihail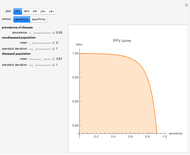 Analysis of Diagnostic Accuracy Measures
Theodora Chatzimichail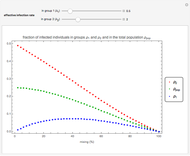 Mixing and Infection in a Two-Group SIS Model
Segismundo S. Izquierdo, Luis R. Izquierdo and Dunia López-Pintado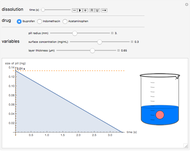 Dissolution of Common Medications as Modeled by Drug Release Kinetics
Megan Mitchell and John Yoon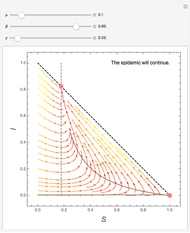 Dynamics of an Epidemic
Marcin Choi?ski Spread of Zika in Brazil Using the Ross-MacDonald Model
Jessica Lu and John Kwak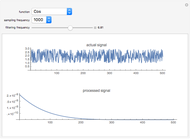 Processing a Neurological Multiunit-Activity Signal
Subashini Lakshmanan
-
 Exact Confidence Intervals for a Single Proportion
Theodora Chatzimichail -
 Calculation of Diagnostic Accuracy Measures
Theodora Chatzimichail -
Calculator for Diagnostic Accuracy Measures
Theodora Chatzimichail -
Relation of Diagnostic Accuracy Measures
Theodora Chatzimichail -
Correlation of Positive and Negative Predictive Values of Diagnostic Tests
Theodora Chatzimichail -
Analysis of Diagnostic Accuracy Measures for Two Combined Diagnostic Tests
Theodora Chatzimichail -
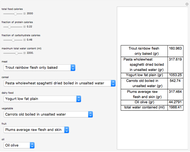 Enteral Nutritional Design
Theodora Chatzimichail -
Analysis of Diagnostic Accuracy Measures
Theodora Chatzimichail