Construct an x-y Diagram for Flash Distillation

Requires a Wolfram Notebook System
Interact on desktop, mobile and cloud with the free Wolfram Player or other Wolfram Language products.
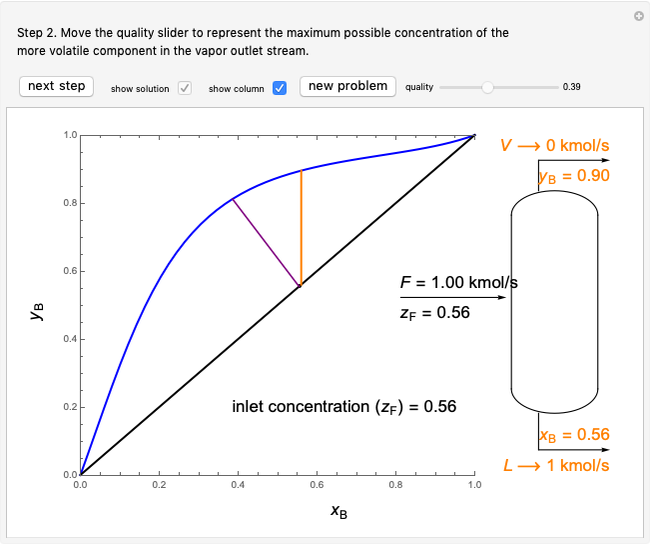
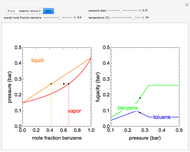
This Demonstration leads you through a step-by-step procedure to generate an  -
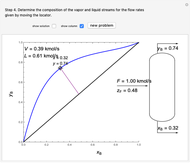
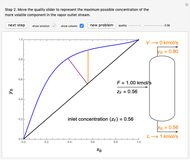
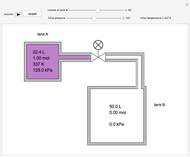
- graph for a binary vapor-liquid equilibrium and then determines outlet compositions for a flash distillation column. Points are moved using a locator on the graph or moving the slider to select the desired quality (defined here as vapor flow rate divided by feed flow rate). After each solution is ready, select "show solution" to see the correct solution and then select "next step". Selecting "show column" presents a representation of the column with flow rates and mole fractions (when "show solution" is selected). At any time, "new problem" can be clicked to generate a new set of values.
Contributed by: Neil Hendren (December 2020)
Additional contributions by: John L. Falconer
(University of Colorado Boulder, Department of Chemical and Biological Engineering)
Open content licensed under CC BY-NC-SA
Snapshots

Details
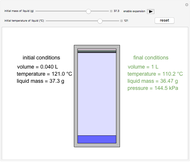
Flash distillation (also known as flash evaporation) is steady-state, single-stage distillation. In this Demonstration, the liquid feed contains two components. An adiabatic throttle reduces the pressure and a fraction of the liquid feed evaporates to maintain constant enthalpy at the lower pressure. Phase equilibrium data at the outlet pressure helps determine the composition and flow rates of the outlet streams.
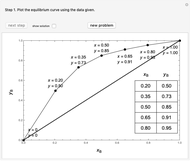
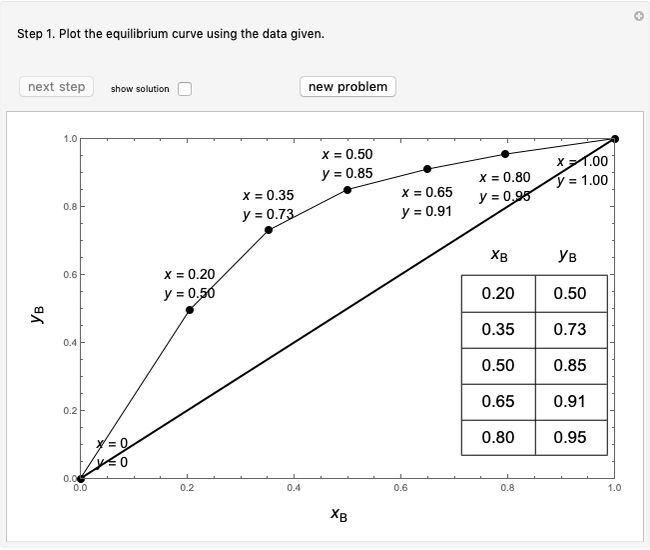
The  -
- equilibrium curve is generated using the modified Raoult's law:
(1)  ,
,
(2)  ,
,
where  and
and  are the liquid and vapor mole fractions (
 for the more volatile component),
  ,
,  ,
,  is total pressure and
  is the saturation pressure, which is calculated using the Antoine equation:
(3)  .
.
The activity coefficients  in this simulation are pseudorandom.
Once the equilibrium curve has been determined, a system can be fully defined by mass balances:
(6)  ,
,
(7)  ,
,
where  ,
,  and
and  are the mole fractions of the more volatile component in the feed, bottoms (liquid) and distillate (vapor) streams, respectively. The flow rates (
 ,
,  ,
,  ) are for the feed, bottoms and distillate, respectively.
In the case of this Demonstration,  and
and  are determined graphically. This is done by reading the
  value and
  value at the intersection of the
  -line with the equilibrium curve. The
  -line equation is a function of the vapor and liquid flow rates and feed conditions:
(8)  ,
,
(9)  .
.
Permanent Citation
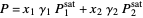
 Construct a P-x-y Diagram for Vapor-Liquid Equilibrium (VLE)
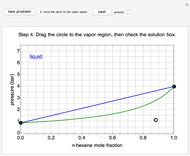
Rachael L. Baumann Construct Single-Stage, Liquid-Liquid Extraction
Rachael L. Baumann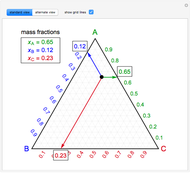 Basic Ternary Phase Diagram
Megan E. Maguire and Rachael L. Baumann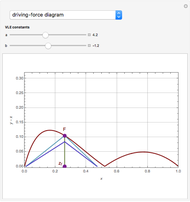 Binary Distillation of Non-Ideal Mixtures Using Driving-Force Diagrams
Housam Binous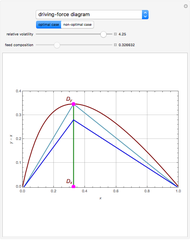 Applications of Driving-Force and McCabe-Thiele Diagrams to Binary Distillation Processes
Housam Binous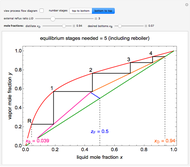 McCabe-Thiele Method for Methanol/Water Separation
Neil Hendren and Rachael L. Baumann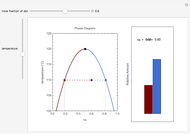 Lever Rule Applied to Phase Diagram for Partially Miscible Liquids
Lisa M. Goss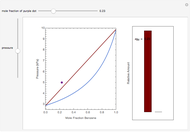 Lever Rule Applied to the Benzene-Toluene Vapor Pressure Diagram
Lisa M. Goss Distillation of a Ternary Ideal Mixture
Housam Binous, Naim Faqir, and Abdallah Al-Shammari Distillation of an Ethanol-Water Mixture
Housam Binous
-
 Construct an x-y Diagram for Flash Distillation
Neil Hendren -
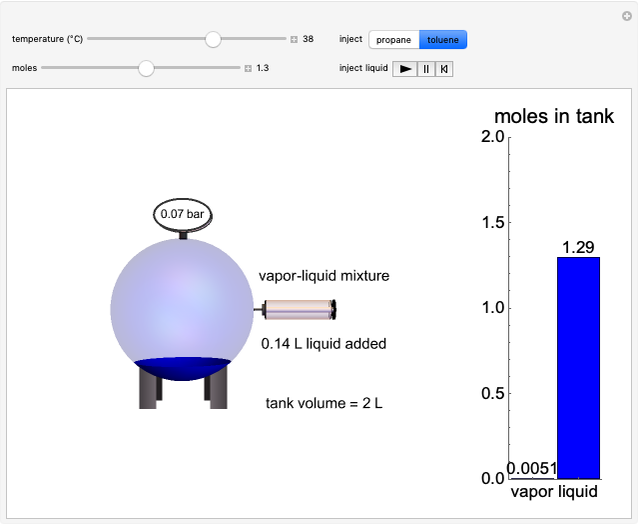 Injecting a Liquid into an Evacuated Tank
Neil Hendren -
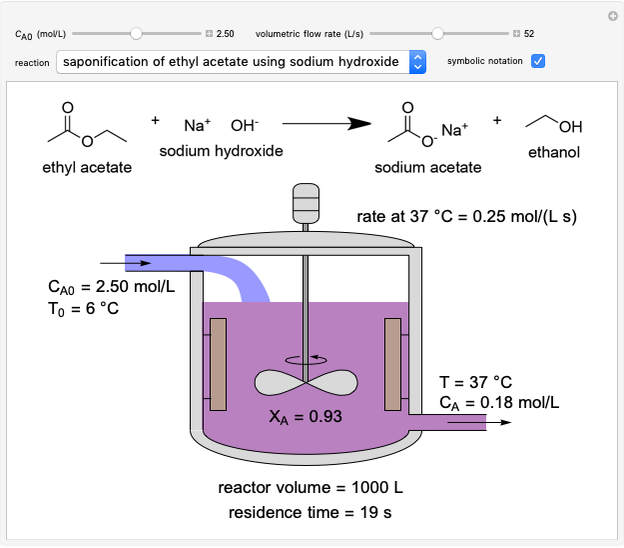 Reaction in an Adiabatic Continuous Stirred-Tank Reactor
Neil Hendren -
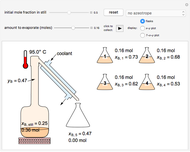 Batch Distillation
Neil Hendren -
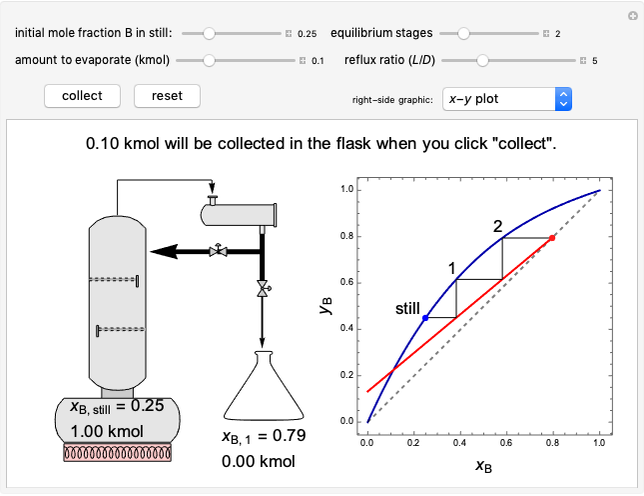 Multistage Batch Distillation
Neil Hendren -
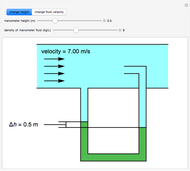 Measuring Flow Rates with a Pitot Tube
Neil Hendren -
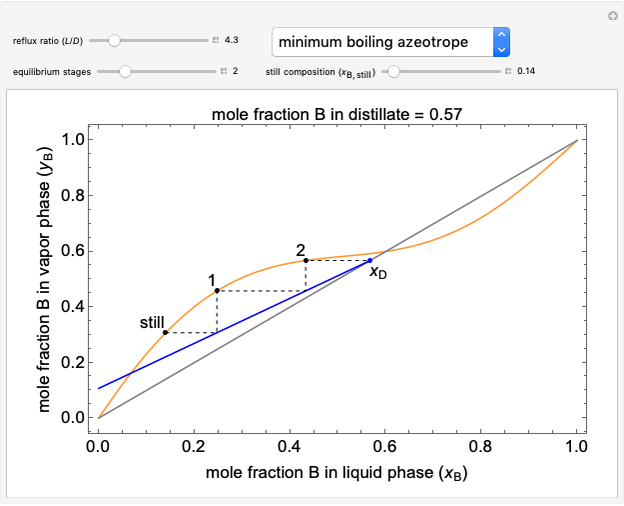 Multistage Batch Distillation with Azeotrope
Neil Hendren -
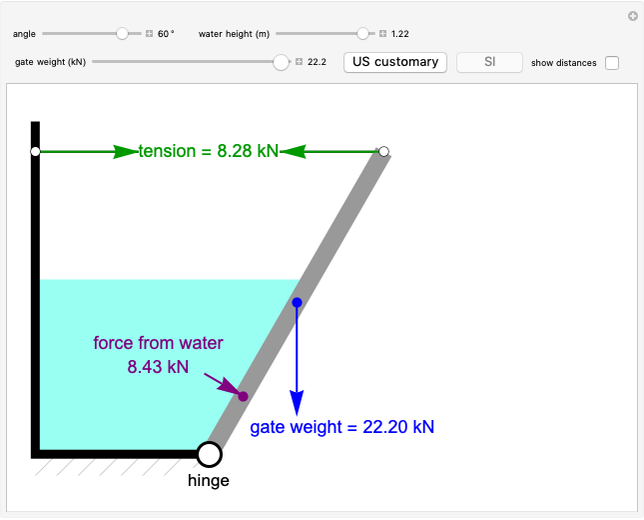 Forces on a Partially Submerged Gate
Neil Hendren -
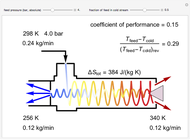 Ranque-Hilsch Vortex Tube
Neil Hendren -
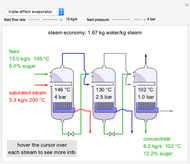 Multiple-Effect Evaporation of Sugar Solution
Neil Hendren -
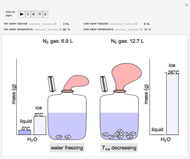 Injecting Water into Liquid Nitrogen Tanks
Neil Hendren -
 Isothermal Plug Flow Reactor
Neil Hendren -
 Reaction in an Isothermal Continuous Stirred-Tank Reactor (CSTR)
Neil Hendren -
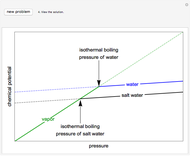 Identify Chemical Potential Plots
Neil Hendren -
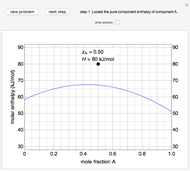 Partial Molar Enthalpy and Entropy Quiz
Neil Hendren -
 Fugacity Dependence on Pressure in an Ideal Binary Mixture
Neil Hendren -
 Adiabatic Gas Expansion between Two Tanks
Neil Hendren -
 Adiabatic Evaporation of Water into Vacuum
Neil Hendren -
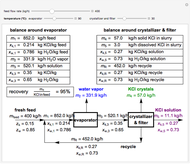 Evaporative Crystallization with Recycle
Neil Hendren -
 Reverse Osmosis
Neil Hendren