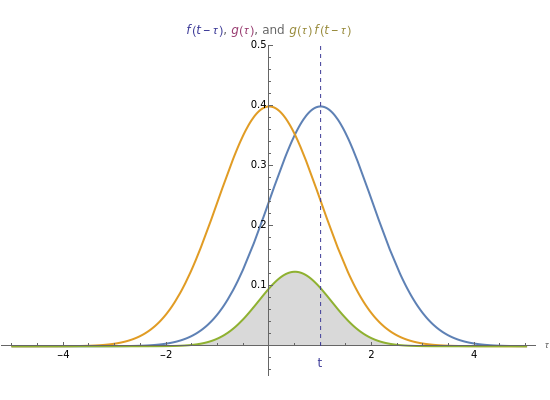
Convolution of Two Densities
Initializing live version

Requires a Wolfram Notebook System
Interact on desktop, mobile and cloud with the free Wolfram Player or other Wolfram Language products.
The convolution of two functions can be thought of as a measure of the overlap of the graphs as one graph is shifted horizontally across the other. Formally, if  and
and  are functions, the convolution of the two is the function
  .
.
Contributed by: Chris Boucher (March 2011)
Open content licensed under CC BY-NC-SA
Snapshots
Details
Permanent Citation


