Distribution of Records


Requires a Wolfram Notebook System
Interact on desktop, mobile and cloud with the free Wolfram Player or other Wolfram Language products.
Consider a sequence of independent, identically distributed, continuous data values  ,
,  , …. A value
  is a record value (or a high-water mark) if it is the largest value among all the values that have been recorded up to time
  . Let
. Let  be the
  record value,
  ; define
  , that is, the first data value is the zeroth record value (or the trivial record). This Demonstration shows the distribution of the record values ,
  , for some distributions of the data.
Contributed by: Heikki Ruskeepää (March 2014)
Open content licensed under CC BY-NC-SA
Snapshots


Details
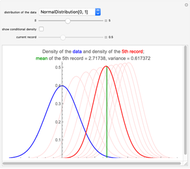
Snapshot 1: The data has a standard normal distribution. As is well known, a value of a random variable from this distribution is, with high probability, in the interval  (see the blue curve). The dark red curve shows the density of the fifth record value (note that, in a sequence of 100 values, the mean number of records is approximately five). We see that the fifth record is, with high probability, in the interval
  . The mean of the fifth record is 2.72. The light red curves show that the variance of the record values has a decreasing pattern. The 10
 record is, with high probability, in the interval
  . The means of the first through 10 record values are as follows: 0.90, 1.50, 1.97, 2.37, 2.72, 3.03, 3.32, 3.59, 3.85, and 4.09. Note that records occur seldomly. For example, for the mean number of records to be 10, we need a sequence of 12,367 values!
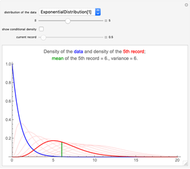
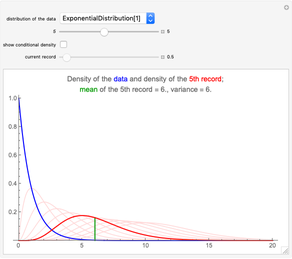
Snapshot 2: The data has an exponential distribution with mean 1. A value of a random variable from this distribution is, with high probability, in the interval  (see the blue curve). The dark red curve again shows the density of the fifth record value. We see that the fifth record is, with high probability, in the interval
  . The mean of the fifth record is 6. The light red curves show that the variance of the record values has an increasing pattern. In fact, the mean and variance of the
  record is
  for the exponential distribution with mean 1.
Snapshot 3: The data has a Weibull distribution. The data is, with high probability, in the interval  , while the fifth record value is, with high probability, in the interval
  . The variance of the record values remains almost constant.
Snapshot 4: The data has a standard uniform distribution. The fifth record value is, with high probability, in the interval  . The mean of the fifth record is 0.984. The variance of the record values has a decreasing pattern. Note that the red curves have been cut at 3.6.
Snapshot 5: The data has a standard normal distribution. Suppose the current record value is 3.0. The figure shows the conditional density and mean of the next record. The conditional mean of the next record is 3.28.
Let the probability density and cumulative distribution functions of the data be  and
and  , respectively. The density function of the record value,
  , is
, is  ; see [1, p. 10]. Moments of record values for the Weibull, power function, Pareto, Gumbel, and normal distribution are derived in [1, Section 2.7] (the extreme value distribution considered in [1] is called the Gumbel distribution in Mathematica); we used Mathematica to derive the results for various distributions.
Suppose that the current record value is  . The conditional density of the next record given the current record is
  ,
,  ; see [1, p. 11].
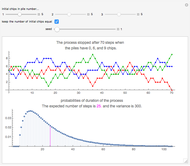
In another Demonstration, Records in Sequences of Random Variables, we also consider record values. There, the results do not depend on the distribution of the data.
Reference
[1] B. C. Arnold, N. Balakrishnan, and H. N. Nagaraja, Records, New York: Wiley, 1998.
Permanent Citation
 Distribution of Discrete Records
Heikki Ruskeepää Records in Sequences of Random Variables
Heikki Ruskeepää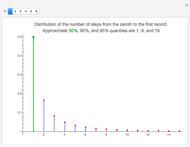 Waiting for the Next Record
Heikki Ruskeepää Distribution of the Sample Range of Continuous Random Variables
Heikki Ruskeepää Distribution of the Sample Range of Discrete Random Variables
Heikki Ruskeepää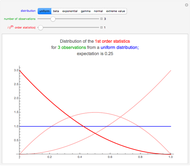 Distributions of Continuous Order Statistics
Heikki Ruskeepää Distributions of Discrete Order Statistics
Heikki Ruskeepää Maximum Likelihood Estimation of Ordinary and Finite Mixture Distributions
Heikki Ruskeepää and M. A. Ghorbani Geometric Distribution
Chris Boucher Binomial Probability Distribution
Paul Savory (University of Nebraska ? Lincoln)
-
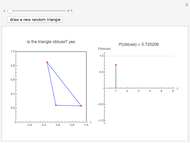 Obtuse Random Triangles from Three Points in a Rectangle
Heikki Ruskeepää -
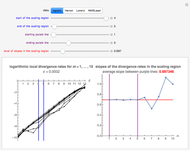 Chaotic Data: Maximal Lyapunov Exponent
Heikki Ruskeepää -
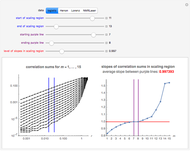 Chaotic Data: Correlation Dimension
Heikki Ruskeepää -
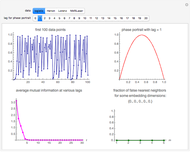 Chaotic Data: Delay Time and Embedding Dimension
Heikki Ruskeepää -
 Method of Support Vector Regression
Heikki Ruskeepää -
 Local Regression for Country Data
Heikki Ruskeepää -
Distribution of the Sample Range of Continuous Random Variables
Heikki Ruskeepää -
Distribution of the Sample Range of Discrete Random Variables
Heikki Ruskeepää -
Distributions of Discrete Order Statistics
Heikki Ruskeepää -
Distributions of Continuous Order Statistics
Heikki Ruskeepää -
Waiting for the Next Record
Heikki Ruskeepää -
Distribution of Discrete Records
Heikki Ruskeepää -
Records in Sequences of Random Variables
Heikki Ruskeepää -
 Distribution of Records
Heikki Ruskeepää -
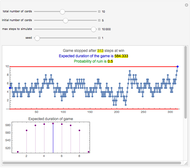
 The Three-Tower Problem
Heikki Ruskeepää -
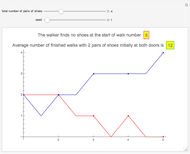 Walking Randomly Until No Shoes Are Available
Heikki Ruskeepää -
 A Reluctant Random Walk
Heikki Ruskeepää -
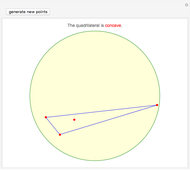 Concave Random Quadrilaterals from Four Points in a Disk
Heikki Ruskeepää -
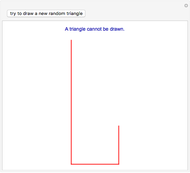 Obtuse Random Triangles from Three Parts of the Unit Interval
Heikki Ruskeepää -
 Spin Game
Heikki Ruskeepää