Estimating and Diagnostic Checking in Censored Normal Random Samples


Requires a Wolfram Notebook System
Interact on desktop, mobile and cloud with the free Wolfram Player or other Wolfram Language products.
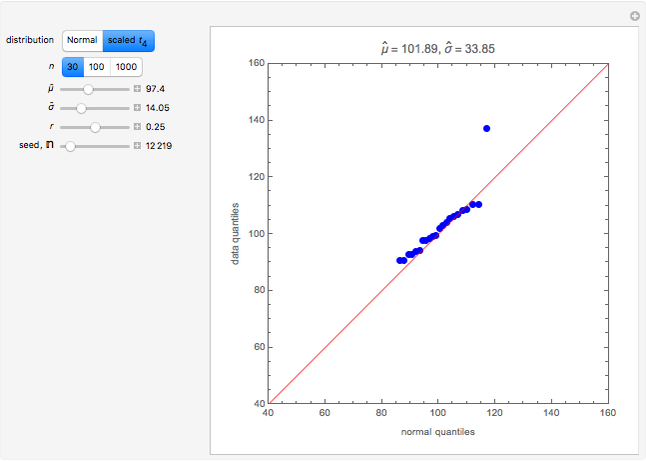
A random sample of size  is simulated from either a normal or scaled
  distribution with mean 100 and standard deviation 15. It is then left-censored corresponding to a detection level
  , where
  is the censor rate and
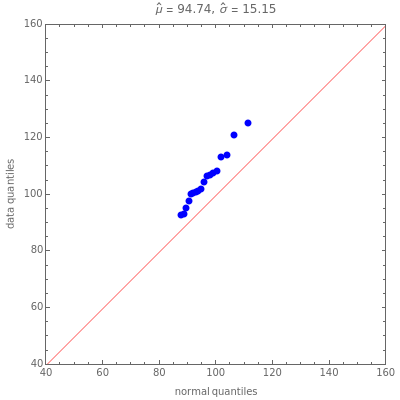
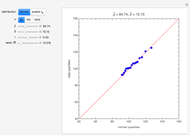
  is the inverse normal cumulative distribution function. The plot shows the data quantiles plotted against the corresponding quantiles in a normal distribution with mean
  and standard deviation
  , where and are estimates that are initially set to
  and
and  . We imagine a robust fitting line that passes through the bulk of the points. Then adjusting shifts the location of this line while shifts its slope. By adjusting and dynamically using the controls, we can find parameter values for which the hypothetical line lies on the 45° line. In other words, the bulk of the data will lie on the 45° line.


Contributed by: Nagham Muslim Mohammad and Ian McLeod (August 2013)
(Department of Statistical and Actuarial Sciences, Western University)
Open content licensed under CC BY-NC-SA
Snapshots


Details
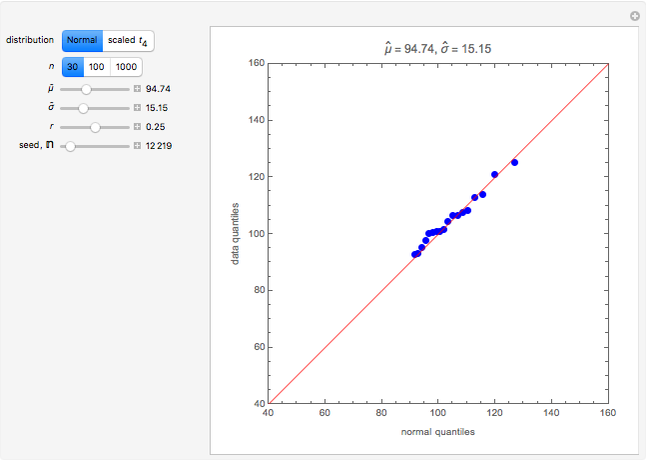
Snapshot 1: by using the maximum likelihood estimates (i.e., setting,  and
and  ), we can use this plot as a model diagnostic to check the adequacy of the normality assumption; in this case, we conclude the model is adequate
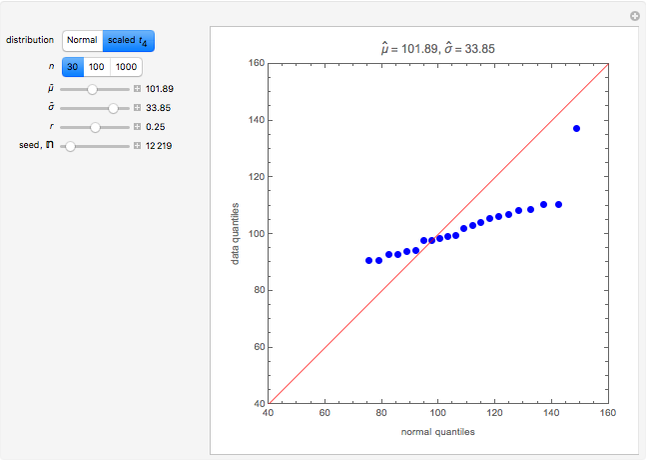
Snapshot 2: the data was generated from the scaled distribution and is not well fit using the Gaussian MLE
Snapshot 3: a better fit and better estimates of the true parameter values  and
and  to the data shown in snapshot 2 are obtained by using the dynamic graph
Gaussian maximum likelihood estimation is often used to estimate the mean and standard deviation in normal random samples [1]. As suggested in [2], the EM algorithm provides an effective algorithm for implementing Gaussian maximum likelihood estimation with censored samples, and this method is used in this Demonstration.
References
[1] M. S. Wolynetz, "Algorithm AS 138: Maximum Likelihood Estimation from Confined and Censored Normal Data," Journal of the Royal Statistical Society. Series C (Applied Statistics), 28(2), 1979 pp. 185–195.
[2] C. R. Robert and G. Casella, Monte Carlo Statistical Methods, New York: Springer, 2004.
Permanent Citation
 Comparing Exact and Approximate Censored Normal Likelihoods
Ian McLeod and Nagham Muslim Mohammad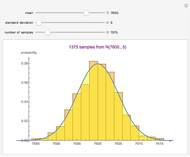 Impact of Sample Size on Approximating the Normal Distribution
Paul Savory (University of Nebraska-Lincoln)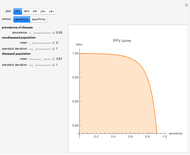 Analysis of Diagnostic Accuracy Measures
Theodora Chatzimichail Informal Power Assessment of the Normal Probability Plot
Ian McLeod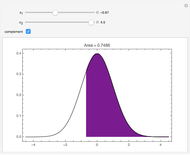 Standard Normal Distribution Areas
Ian McLeod One-Sample t-Test and Confidence Interval with Dot Chart in Small Samples
Douglas Woolford and Ian McLeod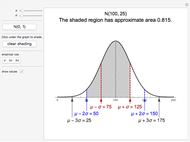 The Empirical Rule for Normal Distributions
Marc Brodie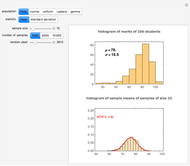 Sampling Distribution of the Mean and Standard Deviation in Various Populations
Ian McLeod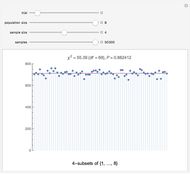 Goodness of Fit for Random Subsets
Michael Rogers (Oxford College of Emory University) Maximum Likelihood Estimation
Marc Brodie (Wheeling Jesuit University)
-
 Rank Transform in Harmonic Regression Time Series
Ian McLeod -
 Detecting Periodicity in Short Time Series
Ian McLeod -
 Tempered Fractionally Differenced White Noise
Ian McLeod -
 Regression toward the Mean
Ian McLeod -
 Spread-Location Regression Diagnostic Check
Ian McLeod -
 Anscombe Quartet
Ian McLeod -
 Visualizing Higher-Dimensional Data with 3D Scatterplots
Ian McLeod -
 Mean, Fitted-Value, Error, and Residual in Simple Linear Regression
Ian McLeod -
 Estimating and Diagnostic Checking in Censored Normal Random Samples
Ian McLeod -
 Comparing Gamma and Log-Normal Distributions
Ian McLeod -
 Monte Carlo Expectation-Maximization (EM) Algorithm
Ian McLeod -
Comparing Exact and Approximate Censored Normal Likelihoods
Ian McLeod -
 Transformation to Symmetry of Gamma Random Variables
Ian McLeod -
 Illustrating the Central Limit Theorem with Sums of Bernoulli Random Variables
Ian McLeod -
 Hidden Correlation in Regression
Ian McLeod -
Informal Power Assessment of the Normal Probability Plot
Ian McLeod -
 Time Series for Power-Law Decay
Ian McLeod -
 Block Bootstrap for Time Series
Ian McLeod -
 Fractional Gaussian Noise
Ian McLeod -
 Plotting a Long Time Series
Ian McLeod