Frequency Response of an LCR Circuit

Requires a Wolfram Notebook System
Interact on desktop, mobile and cloud with the free Wolfram Player or other Wolfram Language products.
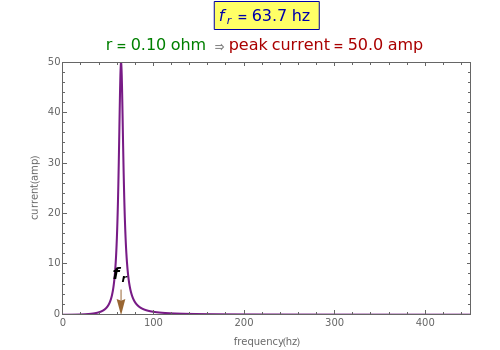
Combined resonance plots of a LCR (inductance-capacitance-resistance) circuit for different values of resistance and at different values of inductance and capacitance.
Contributed by: Contributed by: Kallol Das (St. Aloysius College, Jabalpur, India) (March 2011)
Open content licensed under CC BY-NC-SA
Snapshots
Details
This Demonstration shows the variation of current with frequency in a circuit with the a resistor , capacitor and an inductor in series. The current amplitude is given by the equation, current ∝
 ,
,
Snapshot 1: The variation of current with frequency for the lowest value of resistance. The current amplitude is large and the resonance curve is sharp.
Snapshot 2: The variation of current with frequency for different values of resistance is seen. The current amplitude peaks are large for smaller values of resistances and successively smaller for higher values of the resistance. Higher values of resistances show resonance curves which are broader
Snapshot 3: The resonant frequency  or the peaks of the current amplitude curves shift with change of either the capacitance or inductance values
Permanent Citation


