Function Transformations

Requires a Wolfram Notebook System
Interact on desktop, mobile and cloud with the free Wolfram Player or other Wolfram Language products.
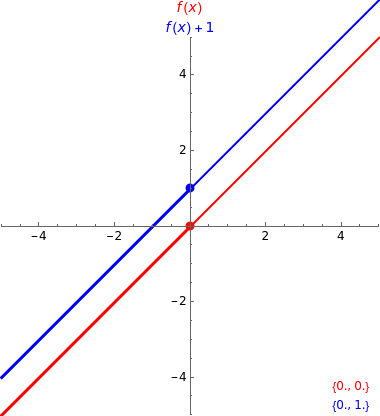
This Demonstration allows you to investigate the transformation of the graph of a function  to
to  for various values of the parameters
  ,
,  ,
,  , and
, and  . In addition to showing the original and transformed curves, it displays an individual movable point on the original curve and the image of the point on the transformed curve. The Demonstration also divides the original curve into two portions and shows the images of these two portions on the transformed curve to emphasize how negative
  values can affect the transformation.
Contributed by: Eric Schulz (September 2007)
Open content licensed under CC BY-NC-SA
Snapshots
Details
Click the + icon next to any parameter slider to enter a specific value or create an animation. The reset checkbox will reset the parameter values to  ,
,  ,
,  ,
,  , and
, and  .
.
Permanent Citation


