Histogram of Flipping Cellular Automaton

Requires a Wolfram Notebook System
Interact on desktop, mobile and cloud with the free Wolfram Player or other Wolfram Language products.
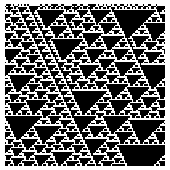
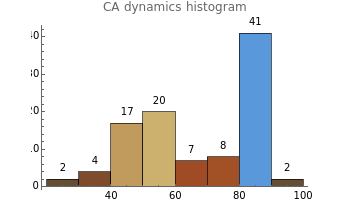
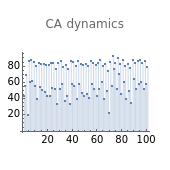
The number of black cells on each row of a cellular automaton (plotted at the lower left) gives some information about the dynamical behavior of the automaton. The flipping cellular automaton shown here alternates between two cellular automaton rules on successive steps. To see a standard elementary cellular automaton, simply set the first and second rules to have the same value.
[more]
Contributed by: Daniel de Souza Carvalho (March 2011)
Open content licensed under CC BY-NC-SA
Snapshots
Details
detailSectionParagraphPermanent Citation
"Histogram of Flipping Cellular Automaton"
http://demonstrations.wolfram.com/HistogramOfFlippingCellularAutomaton/
Wolfram Demonstrations Project
Published: March 21 2011


