Monte Carlo Estimation of Area


Requires a Wolfram Notebook System
Interact on desktop, mobile and cloud with the free Wolfram Player or other Wolfram Language products.
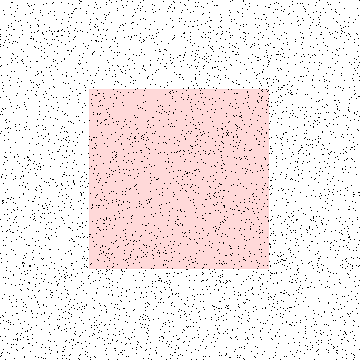
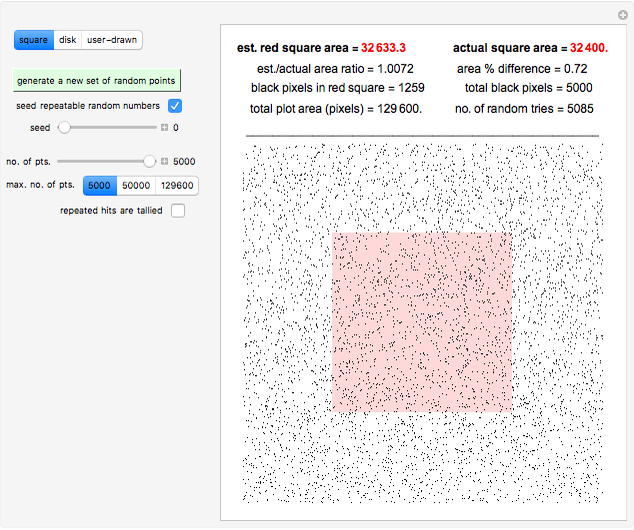
The power of the Monte Carlo method is demonstrated in estimating the area of user-entered polygons. It is done by generating a large number of random points in a larger square of known area and counting those that fall inside the polygon. The method is also demonstrated with a square and a disk whose areas are calculated analytically for comparison.
Contributed by: Mark D. Normand and Micha Peleg (April 2014)
Open content licensed under CC BY-NC-SA
Snapshots
Details
The purpose of this Demonstration is to introduce the Monte Carlo method with familiar geometrical examples. An area enclosed by a regular or irregular perimeter can be estimated from the fraction of random points that fall inside it. If the area of a surrounding square plot region is  (here, the
  plot area contains 129600 pixels), the total number of generated random points (pixels) is
  , and the number of those inside the shape is
  , then the estimated shape’s area is
 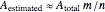 . The larger
  is, the closer is the estimate to the actual area. The principle is demonstrated with a square and a disk whose actual areas are calculated analytically for comparison.
The Demonstration can also create regular and irregular convex and concave polygons having 3 to 30 sides and estimate their area by the Monte Carlo method. The number of random points and their seed (from 1 to 1000) are selected by sliders. The maximum number of allowed points can be chosen with a setter bar to 5000, 50000, or 129600. If the "repeated hits are tallied" box is checked and a random point hits a pixel that has already been generated (black), then it is counted. This means that the number of random points generated is exactly the number specified by the slider, which makes the calculation faster. If the box is unchecked, then the point is not counted and a new random point is generated. This means that many more points may be generated than were specified by the slider, which slows down the calculation. In either case, the total number of all generated random tries is counted and the corresponding area estimate is calculated and both are displayed.
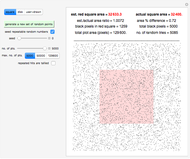
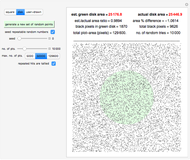
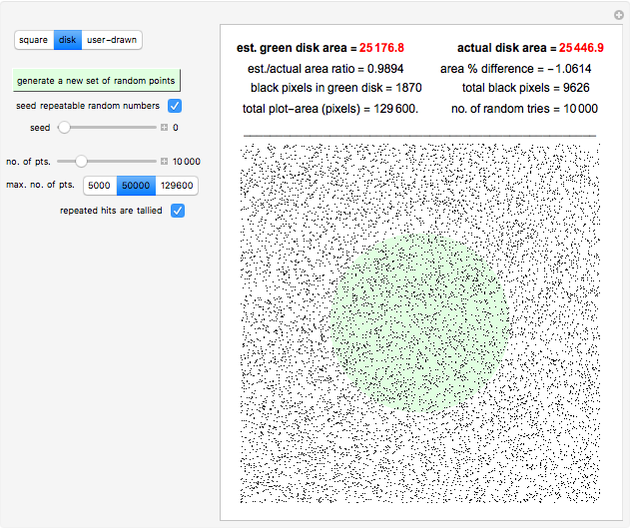
Since the red square aligns perfectly with the rectangular grid of pixels in the display, its area is computed exactly if the number of generated random points equals the number of pixels in the plot region (129600) and "repeated hits are tallied" is unchecked. A small error in the pixel count results from doing the same for the green disk due to its imperfect alignment with the pixel grid.
The square and disk displays include values for the estimated and actual areas, the estimated-to-actual area ratio, and the percent difference between the estimated and actual areas. All figures are also accompanied by the number of generated random points, the number of points within the colored shape, the total number of pixels in the plot region, and the number of random tries needed to generate the requested number of random points.
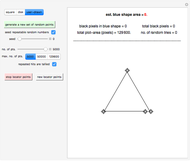
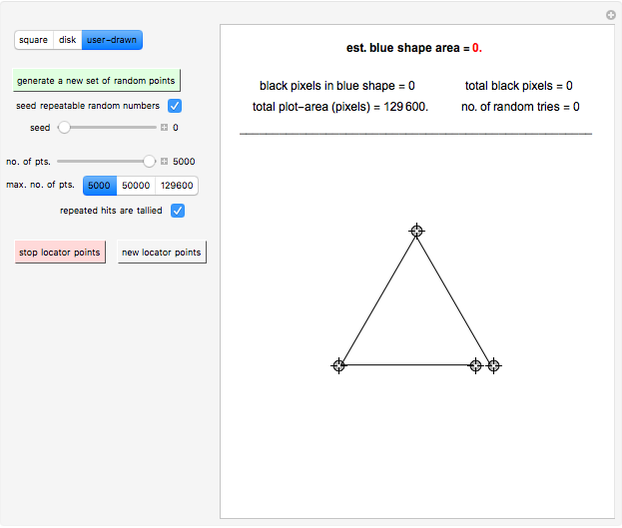
For user-drawn shapes, the minimum number of vertex point locators is four. To move an existing locator, drag it to the desired location. To create a new locator, click on its location within the plot region. To delete an existing locator, hold down the Alt (Windows) or command (Mac OSX) key and click on the locator. The number of allowed locators is between four and 31. To close the drawn polygon, click the red "stop locator points" setter. The final side is then automatically created by connecting the last locator to the first. To begin drawing a new figure from a new set of four locators click the green "new locator points" setter.
Snapshot 1: comparison of a disk's actual area with that estimated by the Monte Carlo method using 1000 random points
Snapshot 2: the initial appearance of a user-drawn shape having the minimum number (4) of locators that appears when the green "new locator points" setter is clicked
Snapshot 3: an equilateral triangle's estimated area computed by the Monte Carlo method using 30000 random points that results from clicking the red "stop locator points" setter without creating any more locators than the original four
Snapshot 4: a user-drawn shape created using 11 locators prior to closing the polygon which is done by clicking on the red "stop locator points" setter
Snapshot 5: the ten-sided irregular polygon that appears from the 11 locators in Snapshot 4 after the red "stop locator points" setter has been clicked and its area has been estimated using 5000 random points
Permanent Citation
"Monte Carlo Estimation of Area"
http://demonstrations.wolfram.com/MonteCarloEstimationOfArea/
Wolfram Demonstrations Project
Published: April 22 2014
 Adaptive Monte Carlo Integration
Sijia Liang and Bruce Atwood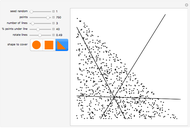 Area Bisectors via Monte Carlo
Ed Pegg Jr Finding the Area of a 3D Surface with Parallelograms
Mark Peterson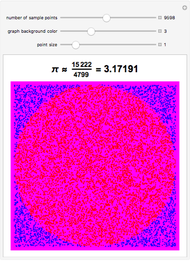 Approximating Pi by the Monte Carlo Method
Zubeyir Cinkir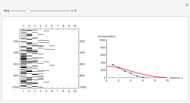 Simulation of 1D Diffusion Using the Monte Carlo Method
Quang-Dao Trinh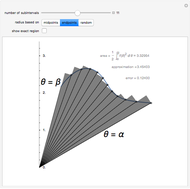 Area Approximation for Polar Plot
Michael Waters Monte Carlo Methods to Estimate Area
Tomas Garza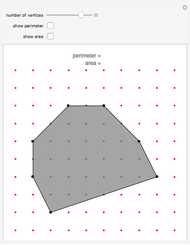 Estimating Perimeter and Area of Simple Polygons
Chris Boucher Isosceles Trapezoid Area
Michael Schreiber Signed Area of a Polygon
Bruce Atwood (Beloit College) and Stan Wagon (Macalester College)
-
 Ratkowski's Square Root Growth Rate Model for High Temperatures
Micha Peleg -
 Gordon-Taylor and Fox Equations for Glass Transition Temperature
Micha Peleg -
 Force to Overcome Vacuum Pull
Micha Peleg -
 Extending the Square Root Growth Rate Model to Lethal Low Temperatures
Micha Peleg -
 Probability of Being Strange According to Paulos
Micha Peleg -
 Successive Three-Point Method for Weibullian Chemical Degradation
Micha Peleg -
 Estimating Cohesion and Tensile Strength of Compacted Powders
Micha Peleg -
 Three-Endpoints Method for Isothermal Weibullian Chemical Degradation
Micha Peleg -
 Vitamin C Loss in Foods During Heat Processing and Storage
Micha Peleg -
 Parameterizing Temperature-Viscosity Relations
Micha Peleg -
 Laplace Distribution in Fluctuating Stock Index Records
Micha Peleg -
 Weibullian Chemical Degradation
Micha Peleg -
 Simulating Ascorbic Acid Degradation
Micha Peleg -
 Additive and Multiplicative Risks
Micha Peleg -
 Endpoints Method for Predicting Chemical Degradation in Frozen Foods
Micha Peleg -
 Exponential Model for Arrhenius Activation Energy
Micha Peleg -
 Prediction of Isothermal Degradation by the Endpoints Method
Micha Peleg -
 Risk Guesstimation from Factor Ranges
Micha Peleg -
 Volatiles Formation Kinetics in Stored Fish
Micha Peleg -
 Comparison of Six Sigmoid Growth Curve Models
Micha Peleg