Nondiscriminating Monopolist with Two Independent Markets


Requires a Wolfram Notebook System
Interact on desktop, mobile and cloud with the free Wolfram Player or other Wolfram Language products.
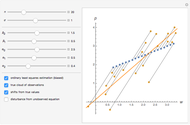
This Demonstration studies an important case in industrial organization: how a nondiscriminating monopolist sets a uniform price in two independent markets. We get the total demand curve by "horizontal summation" of two independent linear demand curves, which arises because of the convention that for demand function  , the dependent variable
  is plotted along the horizontal axis. As a result, the monopolist faces a broken and discontinuous total marginal revenue curve
  , which is a function of
  . This shows the model's difference from the other important case of a discriminating monopolist.
Contributed by: Timur Gareev (November 2015)
Immanuel Kant Baltic Federal University
Open content licensed under CC BY-NC-SA
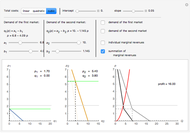
Snapshots
Details
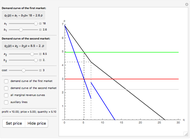
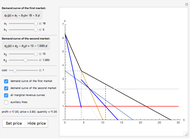
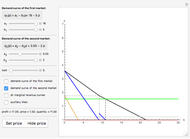
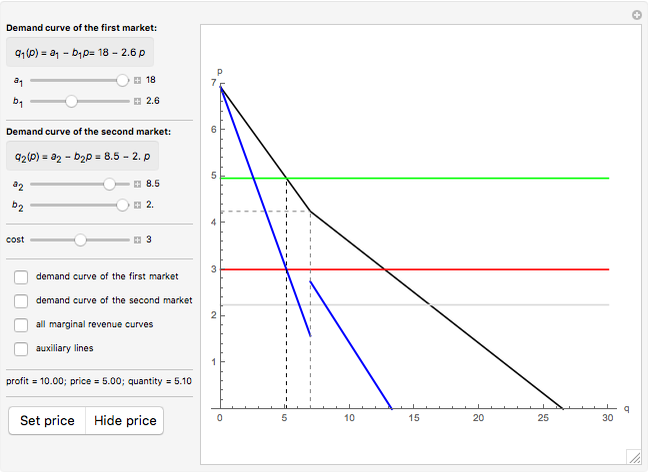
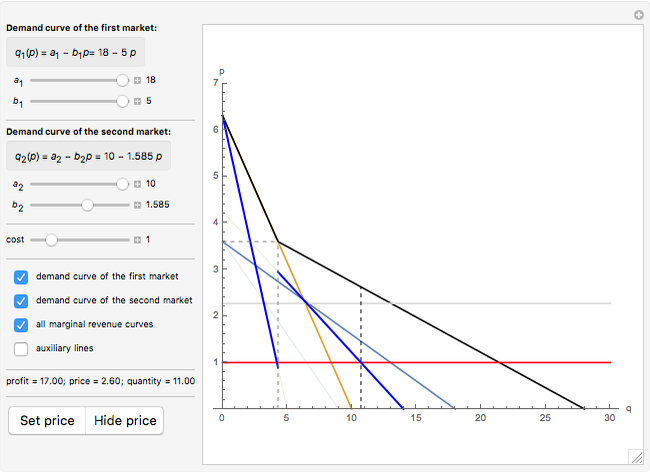
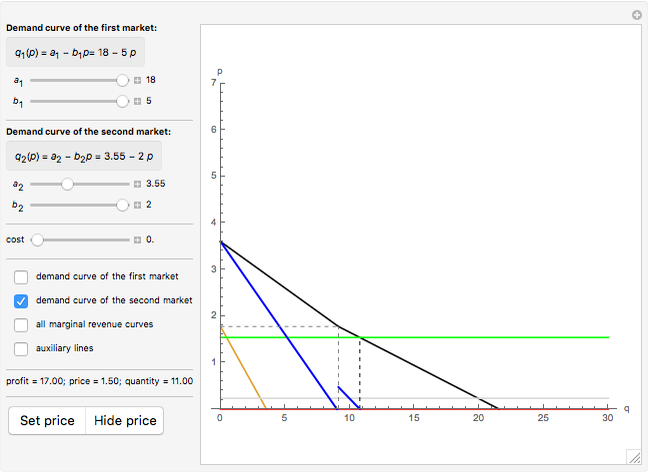
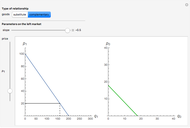
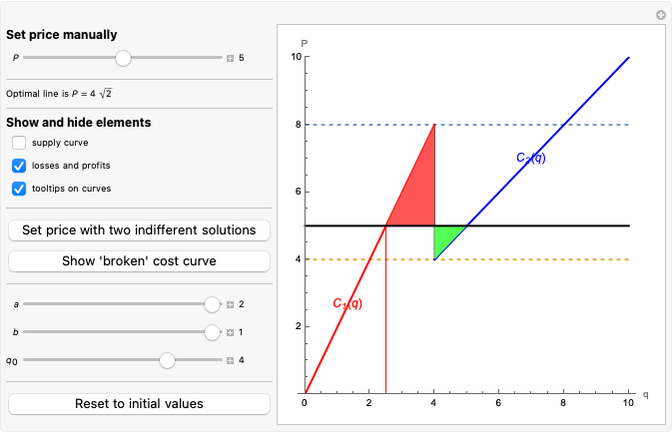
Suppose a monopolist faces two independent markets. In the first market, demand is  , and in the second market, demand is
  . The monopolist solves the typical problem of setting the price (in conjunction with volume of production) so as to maximize total profit collected from both markets. For whatever reason (legal, technological, marketing, etc.), she is nondiscriminating, which means she sets the unified price
  for both markets. As you can see, the monopolist deals with a total demand curve that is piecewise due to the "horizontal summation" of two linear demand curves, because the dependent variable
  is plotted along the horizontal axis. It is also instructive to study the total marginal revenue curve that is discontinuous in the case of a broken total demand curve (use hide/show checkboxes to see how to get it). Such behavior of total marginal revenue poses a problem: how to define the optimal price if we have two pieces of
  that could be equated with a single cost curve. To resolve this problem, we find the indifference level of costs. If the marginal cost curve lies below that level, we use the right piece of
  , and the left piece otherwise. To ease profit calculation, the monopolist's production technology is characterized by constant marginal costs (the red curve is given and can be controlled). All optimal solutions (total profit, price, and quantity) are calculated dynamically on the control panel. Click the "Set price" button to show the optimal price level.
Permanent Citation
 Discriminating Monopolist with Two Independent Markets
Timur Gareev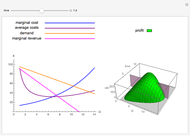 Dynamic Profit Maximization for a Monopolist
Christos Papahristodoulou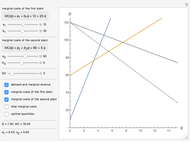 Monopoly with Two Plants
Timur Gareev Monopsony in the Labor Market
Timur Gareev Monopolistic Competition with a Homogeneous Product
Christos Papahristodoulou Krugman's Model of Increasing Returns and Monopolistic Competition
Timur Gareev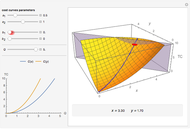 Firm with Two Plants
Timur Gareev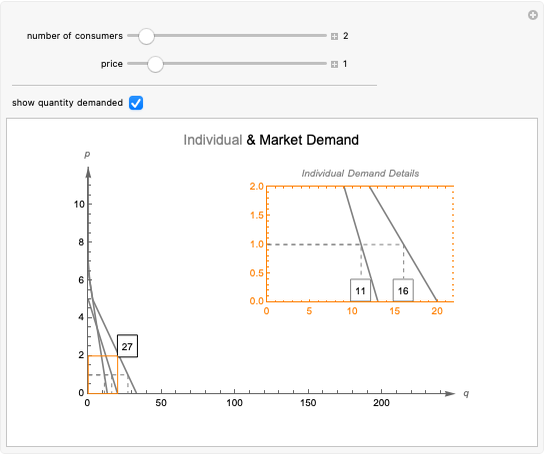 Individual versus Market Demand
Samuel G. Chen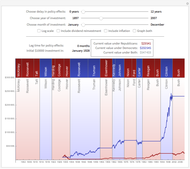 Stock Market Returns by Party
Theodore Gray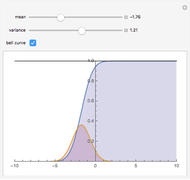 Logistic Sigmoid Market Model
Michael Schreiber
-
Krugman's Model of Increasing Returns and Monopolistic Competition
Timur Gareev -
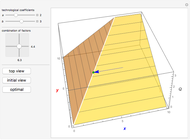
 Returns to Scale in One-Factor Production Functions
Timur Gareev -
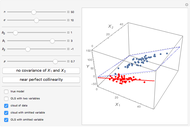 Omitted Variable Bias in 3D
Timur Gareev -
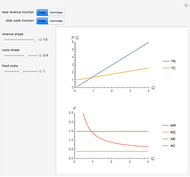 Revenue and Costs Curves Analysis
Timur Gareev -
 Leontief Production Function
Timur Gareev -
 Simultaneity Bias
Timur Gareev -
 Firm Costs Optimization Problem in Primal and Dual Form
Timur Gareev -
 Comparative and Absolute Advantage
Timur Gareev -
Firm with Two Plants
Timur Gareev -
 Elasticity Function
Timur Gareev -
 Substitute and Complementary Goods
Timur Gareev -
Monopoly with Two Plants
Timur Gareev -
 Best Response in Static Two-Player Games
Timur Gareev -
 Hotelling Model of Product Quality Differentiation
Timur Gareev -
 Endogeneity Bias
Timur Gareev -
Discriminating Monopolist with Two Independent Markets
Timur Gareev -
Monopsony in the Labor Market
Timur Gareev -
 Nondiscriminating Monopolist with Two Independent Markets
Timur Gareev -
 Supply Curve from Piecewise Linear Cost Function
Timur Gareev -
 Duopoly Model in 3D
Timur Gareev