Oil Well Decline Modeling Using Hyperbolic-Exponential Forecasting


Requires a Wolfram Notebook System
Interact on desktop, mobile and cloud with the free Wolfram Player or other Wolfram Language products.
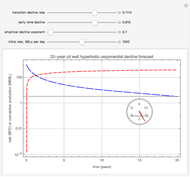
Oil well production rate naturally declines with time as the reservoir depletes and pressure drops. Decline curve analysis (DCA) is a technology that can be used to extrapolate observed early time production to predict future rate performance and the expected ultimate recoverable reserve (EUR) volume that the well will produce during its life (typically 20 to 30 years).
[more]
Contributed by: Peter Janele (February 2017)
Open content licensed under CC BY-NC-SA
Snapshots


Details
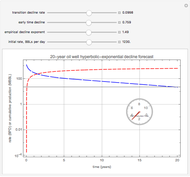
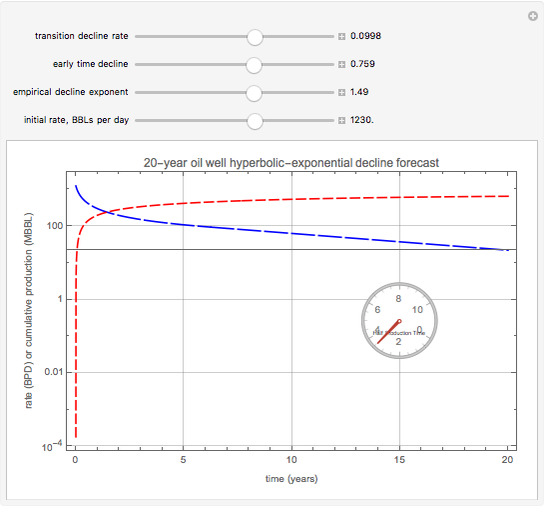
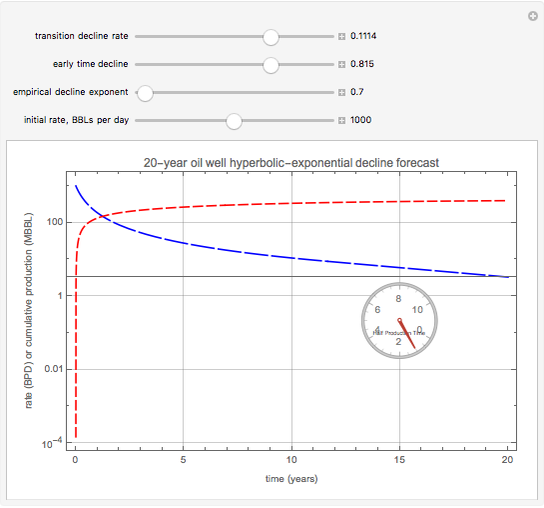
The formulation used in this Demonstration follows an industry-accepted practice of a first phase of hyperbolic decline followed by a second phase of exponential decline. This dual-decline model is typically referred to as the Arps method [1]. Note that this method is not based on physical principles; it is an empirical method that matches historical observations. Additional supporting details for oil and gas well decline are outlined in [2].
The Arps decline formulation is relatively straightforward, which is an advantage compared to more complex and specialized forecasting methods [3]. In practice, the challenge is to find appropriate numerical values for the empirical decline coefficients in the appropriate dimensional units. This Demonstration takes care of unit conversion with expected inputs to be "oil field units"; that is, barrels (BBLs), thousands of barrels (MBBLs) and years. Plausible ranges and default values for each of the four controlling parameters are defined in the code.
Additionally, the output includes a computation (displayed on a dial gauge) that quantifies the number of years to produce half of the maximum resource volume. This calculation of convenience might be useful in comparing alternative production decline scenarios.
References
[1] J. J. Arps, "Analysis of Decline Curves," Transactions of the AIME, 160(1), 1945 pp. 228–247. doi:10.2118/945228-G.
[2] Society of Petroleum Engineers. "PetroWiki: Production Forecasting Decline Curve Analysis." (Feb 2, 2017) petrowiki.org/Production_forecasting_decline _curve _analysis.
[3] Society of Petroleum Engineers. "PetroWiki: Types of Decline Analysis in Production Forecasting." (Feb 2, 2017) petrowiki.org/Types_of_decline _analysis _in _production _forecasting.
[4] Production Forecasting, SPE Reprint Series No. 68, Society of Petroleum Engineers, 2011, CD-ROM.
Permanent Citation
"Oil Well Decline Modeling Using Hyperbolic-Exponential Forecasting"
http://demonstrations.wolfram.com/OilWellDeclineModelingUsingHyperbolicExponentialForecasting/
Wolfram Demonstrations Project
Published: February 3 2017
 Emulating Land Use Evolution with a Cellular Automaton
Seth J. Chandler Trader Dynamics in Minimal Models of Financial Complexity
Philip Maymin Expected Returns of the Dow Industrials, Fama-French Model
Jeff Hamrick and Jason Cawley Statistical Mechanics of Money
Ian Wright Sugarscape: Agent-Based Modeling
Chris Zeng Molecular Dynamics of Lennard-Jones Particles Using the Velocity Verlet Algorithm
José Luis Gómez-Muñoz 3D Boid Model
Jake Zhang Task Partitioning in Insect Societies: A Model Based on Electric Circuits
Allison Hilbun and Istvan Karsai Bootstrapping Credit Default Swap Data
Jeff Hamrick Random Simulation of a Financial Portfolio
Alois Neumann