Pathogen Dose-Response Curves with the Beta Poisson and Lognormal Models

Requires a Wolfram Notebook System
Interact on desktop, mobile and cloud with the free Wolfram Player or other Wolfram Language products.
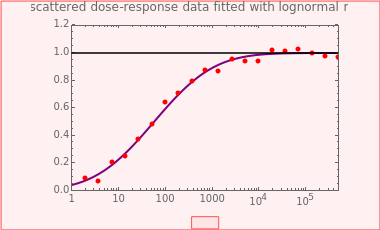
A foodborne or waterborne pathogen's dose-response curve is a plot of the probability of acute infection or death as a function of its ingested number. It has been frequently described by the beta Poisson model and less often by other models, including the cumulative form of the lognormal distribution. The purpose of this Demonstration is to show that for all practical purposes, the beta Poisson and lognormal distribution models can be used interchangeably over a large range of the ingested pathogen's numbers.
Contributed by: Mark D. Normand and Micha Peleg (April 2011)
Open content licensed under CC BY-NC-SA
Snapshots
Details
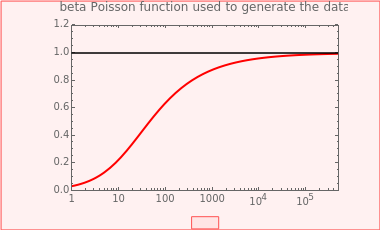
This Demonstration generates scattered dose-response data of hypothetical pathogens using the beta Poisson model and fits the data with the cumulative form (CDF) of the lognormal distribution which would be produced when the expanded Fermi solution method is used to create the dose-response curve. The Demonstration displays the generated data and fitted curve on the upper plot and the original beta Poisson curve on the lower plot. It also displays the fitted lognormal distribution's logarithmic mean,  , its logarithmic standard deviation,
  , and coefficient of determination,
  , above the plots.
Snapshot 1: virulent pathogen, small scatter, linear plot
Snapshot 2: virulent pathogen, small scatter, loglinear plot
Snapshot 3: less virulent pathogen, large scatter, loglinear plot
The user chooses the plot's  axis type, linear or logarithmic, using a setter bar. The beta Poisson function used to generate the data is defined as
  and its parameters,
  and
and  , are entered with sliders. The number of data points and their scatter's amplitude are entered with sliders. To generate a repeatable data set check the "seed repeatable random numbers" box and choose the seed with the slider below. The upper limit of the ingested number of pathogens
  axis is entered with the bottom slider.
Note that not all the plots that can be generated by the Demonstration necessarily correspond to the dose-response curves of actual pathogens.
References:
D. L. Holcomb, M. A. Smith, J. G. 0. Ware, Y-C. Hung, R. E. Brackett, and M. P. Doyle, "Comparison of Six Dose-Response Models for Use with Food-Borne Pathogens", Risk Analysis, 19(6), 1999 pp. 1091–1099.
P. F. M. Teunis, O. G. van der Heijden, J. W. B. van der Giessen, and A. H. Havelaar, The Dose Response Relation in Human Volunteers for Gastro-Intestinal Pathogens, Technical Report 284550002, Rijksinstituut voor Volksgezondheid en Milieu RIVM, 1996.
T. A. Bartrand, M. H. Weir, and C. N. Haas, "Dose-Response Models for Inhalation of Bacillus Anthracis Spores: Interspecies Comparisons", Risk Analysis, 28(4), 2008 pp. 1115–1124.
Permanent Citation


