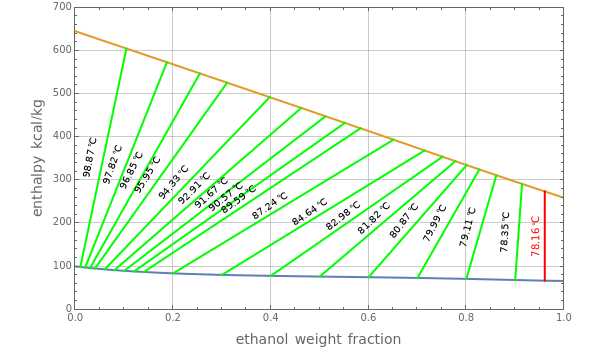
Ponchon-Savarit Diagram for an Ethanol-Water Binary Mixture

Initializing live version
Download to Desktop

Requires a Wolfram Notebook System

Interact on desktop, mobile and cloud with the free Wolfram Player or other Wolfram Language products.

The Ponchon–Savarit diagram provides a graphical method for solving coupled material and energy balances in separation processes involving binary mixtures. This Demonstration illustrates how the Ponchon–Savarit diagram can be computed for a nonideal binary mixture that has an azeotrope.

[more]

Consider a binary mixture of ethanol and water at a low to moderate pressure, , to be selected by the user. The gas phase is assumed ideal, but the liquid phase is nonideal. The Demonstration plots the Ponchon–Savarit diagram, which is also called the enthalpy-composition diagram. Enthalpy is expressed in kcal/kg and composition is expressed in weight fraction of ethanol. Also shown is the vapor equilibrium curve for ethanol-water.

Enthalpies for the liquid and vapor phases are computed using the following equations:

,

,

where is the latent heat of vaporization of chemical species at and and are the heat capacities for the liquid and the gas phases of chemical species , respectively; is a slowly-varying function of temperature and can be assumed constant [3]. The mole fractions of ethanol in the liquid and gas phases are denoted by and , respectively. Finally, is the excess enthalpy, which accounts for the nonideal behavior of the liquid mixture. We use the following correlation from [2] to compute the excess enthalpy as a function of composition and temperature:

, where is the mixture temperature and is the ethanol mole fraction. Here, , where and , , and are appropriate constants tabulated in [2].

The first snapshot of the Ponchon–Savarit diagram for is in full agreement with Figure 2-4 in [1].

Finally, the "tie lines", displayed in green, show the composition of the two phases that exist in equilibrium at the specified temperature. At the azeotropic composition the tie line is shown in red; it is vertical, confirming that at the azeotrope. At , the azeotrope composition in terms of ethanol weight fraction is 96% and the boiling temperature is .

[less]

Contributed by: Housam Binous, Nadhir A. Al-Baghli, and Brian G. Higgins  (January 2012)
Open content licensed under CC BY-NC-SA


Snapshots


Details

References

[1] P. C. Wankat, Separation Process Engineering, 3rd ed., Upper Saddle River, NJ: Pearson, 2012.

[2] J. A. Larkin, "Thermodynamic Properties of Aqueous Non-Electrolyte Mixtures I. Excess Enthalpy for Water + Ethanol at 298.15 to 383.15 K," Journal of Chemical Thermodynamics, 7(2), 1975 pp. 137–148.

[3] R. H. Perry and D. W. Green, Perry's Chemical Engineers' Handbook, 7th ed., New York: McGraw–Hill, 1997.


Feedback (field required)
Email (field required) Name
Occupation Organization
Note: Your message & contact information may be shared with the author of any specific Demonstration for which you give feedback.
Send