Principal Components Analysis: Application in Value at Risk and Expected Shortfall

Initializing live version
Download to Desktop

Requires a Wolfram Notebook System

Interact on desktop, mobile and cloud with the free Wolfram Player or other Wolfram Language products.

Principal Component Analysis (PCA) is used in financial risk management to reduce the dimensionality of a multivariate problem, thus creating a simpler representation of the risk factors in the dataset. Only a few judiciously chosen hypothetical variables are needed to explain a large proportion of the variability in the data. These principal components are obtained through the singular value decomposition of the return series.

[more]

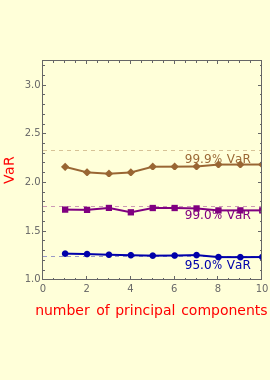
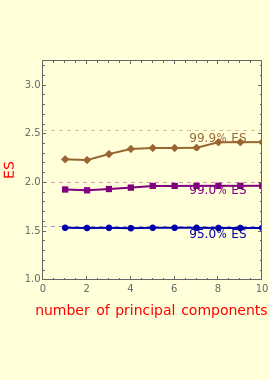
Consider the case of a portfolio consisting of 10 assets, each yielding returns characterized by the standard normal distribution (with mean 0 and standard deviation 1) and correlated with one another via a correlation matrix, with the entry between asset and asset given by . To study the effectiveness of PCA, a series of synthetic portfolio returns is generated, each incorporating an increasing number of principal components. As functions of the number of principal components, both Value at Risk (VaR) and Expected Shortfall (ES) of the synthetic portfolios are relatively flat for . Thus, only three principal components are needed to approximate these extreme statistics of the portfolio.

Suppose an investor concerned about possible losses in the value of a portfolio wants to know, out of the worst five possible losses during the next 100 days, what is the smallest of these five losses: that is VaR at 95% confidence level (𝒸𝓁) over a 100-day horizon. The average of these five worst losses is given by ES at 95% 𝒸𝓁.

As a reference, the "asymptotic" VaR and ES are shown as the horizontal dashed lines. These asymptotic statistics are based on simulating a large amount of data ( observation days) using the full set of () principal components. The time evolution shows that the 95% confidence level (𝒸𝓁) VaR and ES are more robust than their 99% 𝒸𝓁 counterparts, hugging closer to their asymptotic values. As expected, the higher 99% 𝒸𝓁 VaR and ES are less robust because of the greater data variability inherent in the more extreme tail of the distribution.

The precision of the portfolio VaR and ES is a function of sample size: the larger the number of data points in the return series, the smaller the dispersion in the statistics. This notion is evidenced through smaller fluctuations in the PCA VaR and ES using a larger number of observation days.

[less]

Contributed by: Pichet Thiansathaporn (July 2012)
Open content licensed under CC BY-NC-SA


Snapshots


Details

Snapshot 1: PCA VaR stabilizes when the number of principal components exceeds three

Snapshot 2: divergence of PCA VaR (plotted points) from the "true" asymptotic VaR (dashed horizontal lines) is more pronounced: (1) toward the tail of the distribution (higher confidence level); and (2) with a small number of data points (1,000 observation days)

Snapshot 3: divergence decreases with a larger number of data points (10-fold increase from Snapshot 2)

Reference

[1] Kevin Dowd, Measuring Market Risk, 2nd ed., West Sussex, England: Wiley, 2005 pp. 118–125.


Feedback (field required)
Email (field required) Name
Occupation Organization
Note: Your message & contact information may be shared with the author of any specific Demonstration for which you give feedback.
Send