Regression toward the Mean


Requires a Wolfram Notebook System
Interact on desktop, mobile and cloud with the free Wolfram Player or other Wolfram Language products.
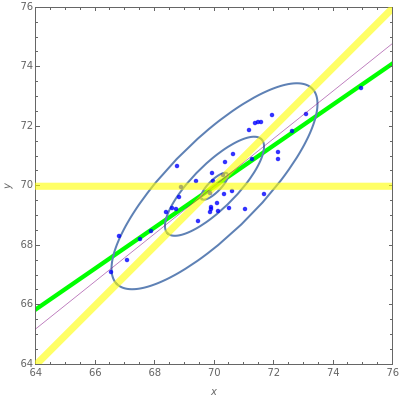
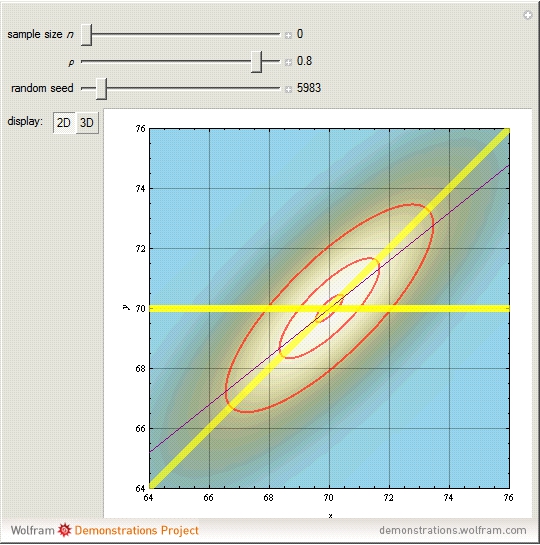
Regression owes its name to the phenomenon known as regression toward the mean that arises when a genetically determined characteristic, such as height, is correlated between parent and offspring. This results in a regression line, offspring height on parent height, that is characterized by a tall parent's offspring also being tall but less so, on average, than the parent and, similarly, a short parent's offspring also being short but not as short as the parent. Assuming that the univariate distributions of the parent and offspring are the same, this implies that the expected regression line will be less than the  line for large values of the characteristic, and conversely for small values. The two yellow lines correspond to or equivalently
  , where
  is the correlation and
  , the mean, or equivalently
  . When
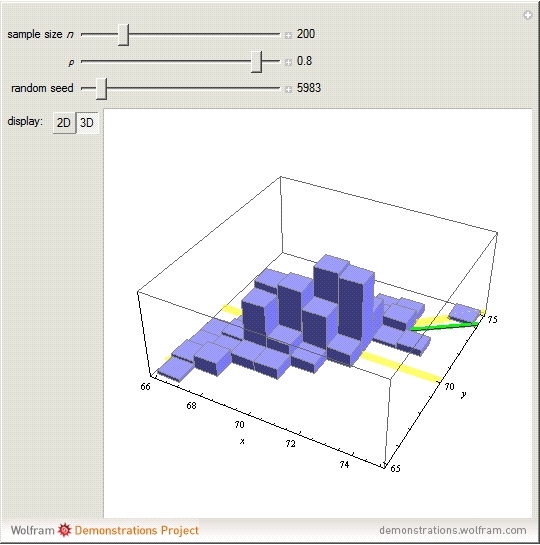
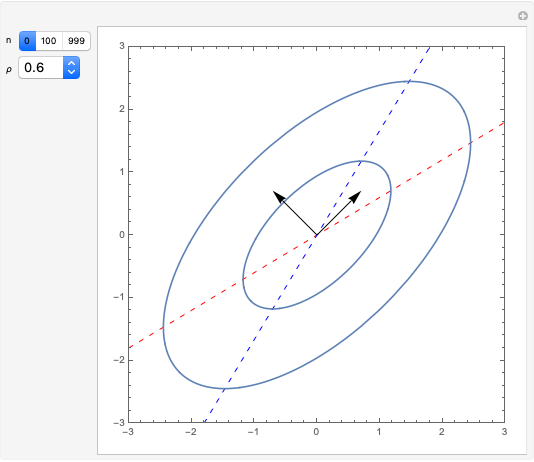
  , the thin purple line, the expected regression line, is always between the two yellow lines demonstrating regression toward the mean. The red ellipses show the ellipsoids of concentration corresponding to 95%, 50%, and 5% probability in the bivariate normal distribution. The blue points are data simulated from the regression, and the green line shows the fitted regression line. In some cases, especially when the sample size
  is small, regression toward the mean may not hold for the fitted regression line. A 3D visualization is also provided. When
  , only the purple expected regression line
  , where
  , and the concentration ellipsoids for the bivariate distribution are shown on a background generated by the DensityPlot[]. See the Details section for further discussion.
Contributed by: Ian McLeod (October 2013)
(Department of Statistical and Actuarial Sciences, Western University)
Open content licensed under CC BY-NC-SA
Snapshots
Details
"Mere varieties from a common typical centre blend freely in the offspring, and the offspring of every race whose statistical characters are constant, necessarily tend, as I have often shown, to regress towards their common typical centre." [1, p. 211].
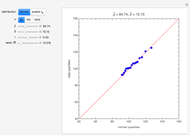
Let  be bivariate normal with means and standard deviations equal to 70 and 2, respectively, and correlation coefficient . The thumbnail shows a scatter plot of a random sample of size
  from this distribution. The parameters 70 and 2 were chosen to represent a hypothetical male population with average height 70" and standard deviation 2".
Snapshot 1: with  , the green line shows the theoretical regression line
Snapshot 2: the 3D visualization shows the Histogram3D plot of the data shown in the thumbnail; drag for a better view of the green and yellow lines
Snapshot 3: with , a 3D plot of the bivariate normal distribution is shown; drag to rotate the green and yellow lines into view
Snapshot 4: regression toward the mean may not hold for the fitted regression line when the sample size is small
For further information, see the Wikipedia article on regression toward the mean.
[1] F. Galton, Finger Prints, London: Macmillan, 1892. www.gutenberg.org/ebooks/36979.
Permanent Citation
 Karhunen-Loeve Directions and Regression
Ian McLeod Hidden Correlation in Regression
Ian McLeod and Yun Shi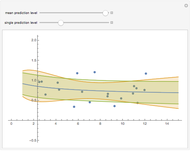 Mean and Single Prediction Bands for a Nonlinear Model
Darren Glosemeyer Mean, Fitted-Value, Error, and Residual in Simple Linear Regression
Ian McLeod Confidence Intervals for a Mean
Chris Boucher Hypothesis Tests about a Population Mean
Chris Boucher The Power of a Test Concerning the Mean of a Normal Population
Chris Boucher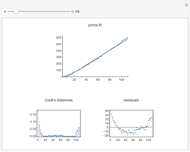 Fitting Primes to a Linear Model
Darren Glosemeyer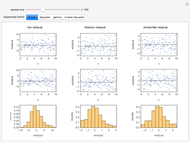 Comparing Some Residuals for Generalized Linear Models
Darren Glosemeyer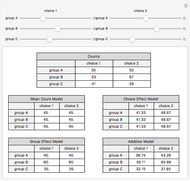 Comparing Models for Two-Way Contingency Tables
Darren Glosemeyer
-
 Rank Transform in Harmonic Regression Time Series
Ian McLeod -
 Detecting Periodicity in Short Time Series
Ian McLeod -
 Tempered Fractionally Differenced White Noise
Ian McLeod -
 Regression toward the Mean
Ian McLeod -
 Spread-Location Regression Diagnostic Check
Ian McLeod -
 Anscombe Quartet
Ian McLeod -
 Visualizing Higher-Dimensional Data with 3D Scatterplots
Ian McLeod -
Mean, Fitted-Value, Error, and Residual in Simple Linear Regression
Ian McLeod -
 Estimating and Diagnostic Checking in Censored Normal Random Samples
Ian McLeod -
 Comparing Gamma and Log-Normal Distributions
Ian McLeod -
 Monte Carlo Expectation-Maximization (EM) Algorithm
Ian McLeod -
 Comparing Exact and Approximate Censored Normal Likelihoods
Ian McLeod -
 Transformation to Symmetry of Gamma Random Variables
Ian McLeod -
 Illustrating the Central Limit Theorem with Sums of Bernoulli Random Variables
Ian McLeod -
Hidden Correlation in Regression
Ian McLeod -
 Informal Power Assessment of the Normal Probability Plot
Ian McLeod -
 Time Series for Power-Law Decay
Ian McLeod -
 Block Bootstrap for Time Series
Ian McLeod -
 Fractional Gaussian Noise
Ian McLeod -
 Plotting a Long Time Series
Ian McLeod