Rovibronic Spectrum of a Perpendicular Band of a Symmetric Rotor

Requires a Wolfram Notebook System
Interact on desktop, mobile and cloud with the free Wolfram Player or other Wolfram Language products.
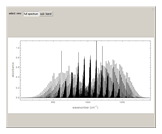
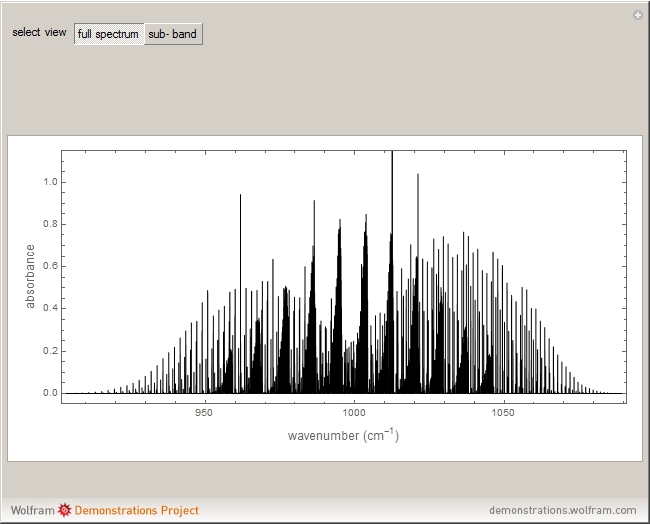
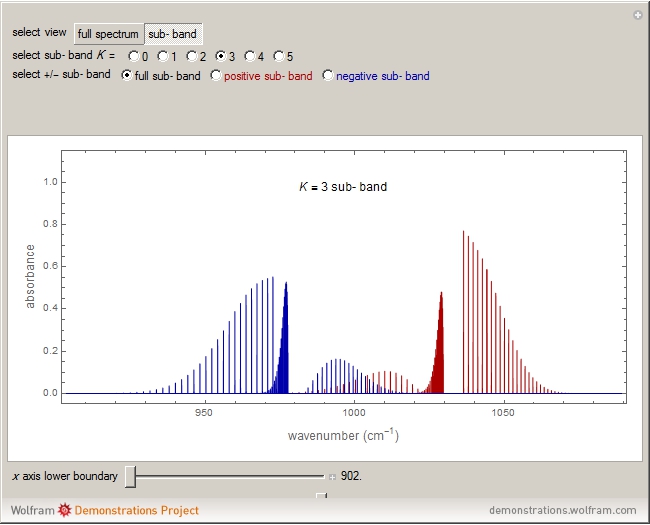
This Demonstration shows the rotationally resolved infrared spectrum of a perpendicular band of a symmetric rotor. It uses a top-down approach, with each level of options deconstructing the spectrum and revealing more details about its structure. You can view the full spectrum or choose to view the sub-bands in order to unlock the other control options and further deconstruct the sub-bands. It is also possible to zoom into any region of the spectrum by using the  axis lower-limit and upper-limit boundary controls.
Contributed by: Whitney R. Hess and Lisa M. Goss (March 2011)
(Idaho State University)
Open content licensed under CC BY-NC-SA
Snapshots
Details
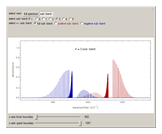
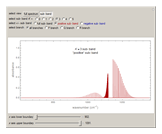
In this Demonstration, the "full spectrum" view option does not use the Manipulate functionality. Selecting "sub-band" allows you to explore the six  sub-bands as well as to select the +/- sub-band. Selecting "positive sub-band" or "negative sub-band" shows the individual branches. Selecting "
 branch", "
 branch", or "
 branch" allows you to view the rotational transitions (by selecting
  within each branch.
Lower state constants are indicated by a superscript double prime (″) and excited state constants are indicated by a superscript prime (′).
The spectrum is simulated at a temperature of 150 Kelvins and the mathematical expressions for determining line positions in the spectrum assume the centrifugal distortion constants ( ) and the anharmonicity constant (
 ) are negligible. Unequal values for the lower and excited state rotational constants
  and
and  were used in order to account for the interaction of rotation and vibration (
 ). The following rotational constants were used to simulate the spectrum:
  ,
,  ,
,  , and
, and  .
.
The transitions are labeled according to the format  , where
  ,
,  ,
,  , and
, and  are as follows:
 : transitions with
  are designated with a superscript
  (positive sub-band) and transitions with
  are designated with a superscript
  (negative sub-band)
 : designated
  ,
,  , or
, or  depending on which branch the line resides (
 , respectively)
 : the value of
  is indicated by the subscript
 : the value of
  is indicated within the parentheses
For example,  indicates the line corresponding to the
  transition in the
  branch within the
  positive sub-band.
Snapshots 1, 2, 3, and 4: full spectrum, full sub-band, positive sub-band, and negative sub-band views, respectively
Snapshot 5: when  ,
,  , or
, or  branch is selected, the rotational transitions in each band can be explored and the spectral line corresponding to the transition of interest will be labeled according to the format previously described
References
[1] P. Atkins and J. de Paula, Physical Chemistry, New York: Oxford University Press, 2006.
[2] G. Herzberg, Molecular Spectra and Molecular Structure II. Infrared and Raman Spectra of Polyatomic Molecules, Princeton, NJ: D. Van Nostrand Company, Inc., 1945.
Permanent Citation


