Simulated Jagged Force-Displacement Curves


Requires a Wolfram Notebook System
Interact on desktop, mobile and cloud with the free Wolfram Player or other Wolfram Language products.
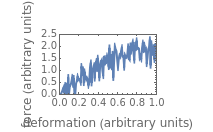
The compressive force-displacement curves of intact brittle cellular particulates, such as puffed cereals and snacks, are characteristically irregular and irreproducible. To create their "typical" curve, one can test several particulates, fit the resulting recorded experimental force-displacement data with a polynomial model, and generate random fluctuations around it. If  particles are tested, one can average the polynomial model's coefficients to create a smoothed curve and superimpose on it the averaged fluctuations' amplitudes multiplied by
  . The result is a "typical" force-displacement curve that is practically indistinguishable from a real experimental one. The principle and method are demonstrated with simulated curves having different degrees of jaggedness.
Contributed by: Mark D. Normand and Micha Peleg (October 2014)
Open content licensed under CC BY-NC-SA
Snapshots

Details
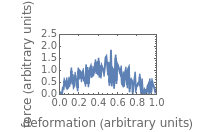
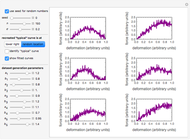
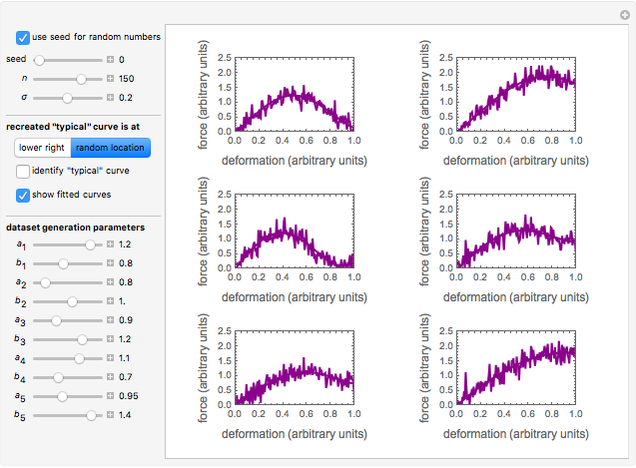
Snapshot 1: The "typical" curve is at the middle-right. Can you tell? Click the "identify 'typical' curve" checkbox to verify its location.
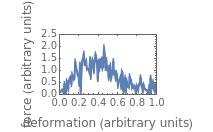
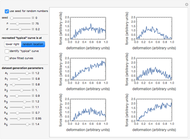
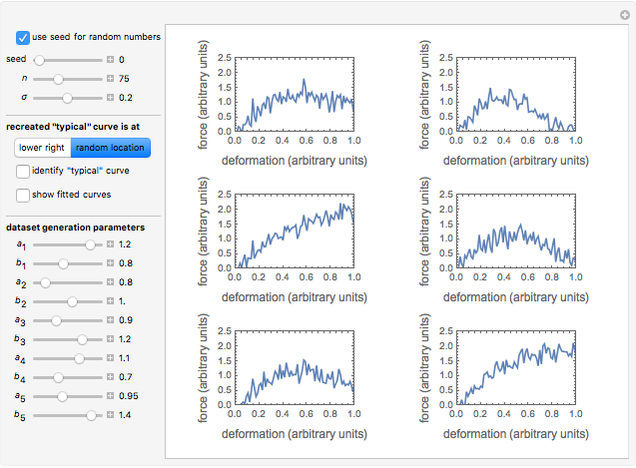
Snapshot 2: The "typical" curve is at the upper-left.
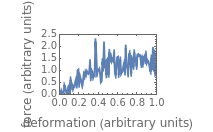
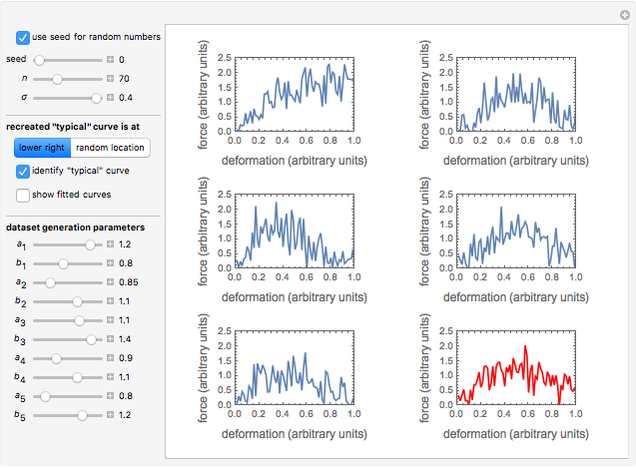
Snapshot 3: The "typical" curve is identified at the chosen lower-right location.
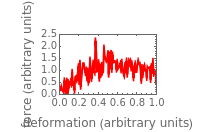
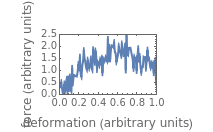
To create a "typical" jagged mechanical signature, five simulated jagged force-displacement curves are generated with the built-in model. This model's equation is  , which governs the signature's overall shape. In this model,
  represents the displacement and
  the corresponding compressive force, both in arbitrary units. Adding random normal noise with zero mean and adjustable standard deviation
  , which controls jaggedness, creates realistic-looking compressive force-displacement curves reminiscent of those of puffed cereals and snacks [1, 2].
The "typical" curve is generated by fitting each of the  signatures with the fourth-degree polynomial model,
  , averaging the coefficients, and superimposing the recreated averaged noise, (
 . Occasional negative force entries at low are converted to positive values.
You first choose with sliders the number of points  in the signatures (which represents the sampling rate) and , the noise’s standard deviation. You then choose the individual signatures' shape parameters,
  to
to  and
and  to
to  . The generated curves are displayed in positions 1–5 and the recreated "typical" curve in position 6 (at lower-right) if the "lower-right" setter is selected.
When the "use seed for random numbers" box is checked, the generated data for and plotting locations of the five generated curves do not change unless the seed value is changed. For each different seed value, clicking the "random location" setter causes the curves' positions to be shuffled and the user is challenged to identify the location of the "typical" curve. When the "identify 'typical' curve'" box is checked, the "typical" curve is drawn in bright red. When the "show fitted curves" box is checked, the fitted curves are plotted in dark magenta on top of the five generated curves and the average polynomial on top of the "typical" curve.
References
[1] D. Ulbricht, M. D. Normand, M. Peleg, and J. Horowitz, "Assessment of the Crumbliness of Individual Fragile Particulates from that of Their Assemblies," Powder Technology, 81, 1994 pp. 83–91.
[2] D. Ulbricht, M. D. Normand, and M. Peleg, "Creating Typical Jagged Force-Deformation Relationships from the Irregular and Irreproducible Compression Data of Crunchy Foods," Journal of the Science of Food and Agriculture, 67, 1995 pp. 453–459.
Permanent Citation
 Erosion Index for Particulates
Mark D. Normand and Micha Peleg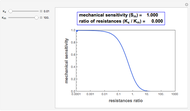 Mechanical Sensitivity of Soft Testing Machines
Mark D. Normand and Micha Peleg Gordon-Taylor and Fox Equations for Glass Transition Temperature
Mark D. Normand and Micha Peleg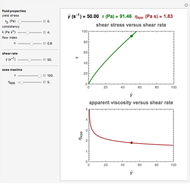 Flow Curves of a Herschel-Bulkley Fluid
Mark D. Normand and Micha Peleg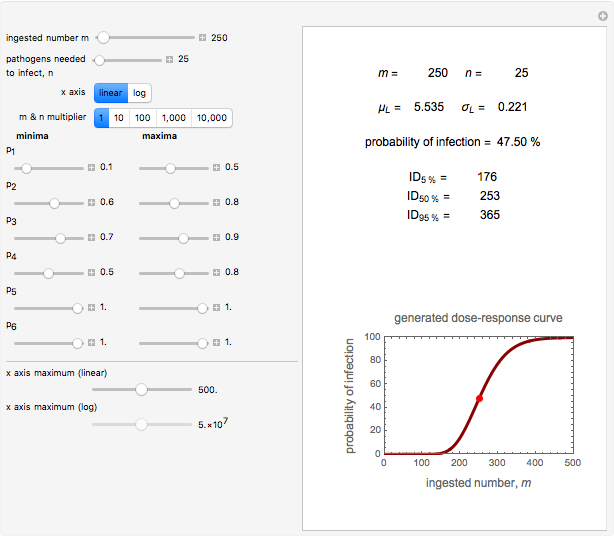 Expanded Fermi Solutions in Pathogens' Dose-Response Curves
Mark D. Normand and Micha Peleg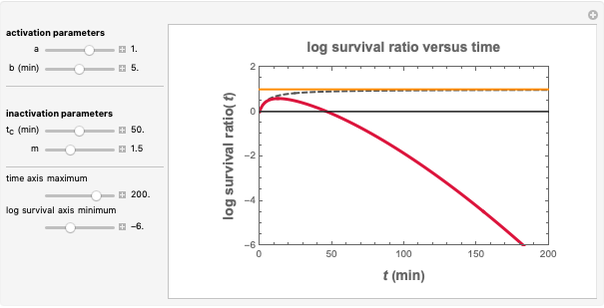 Survival Curves of Bacilli Spores with an Activation Shoulder
Mark D. Normand and Micha Peleg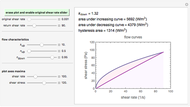 Hysteresis in the Flow Curves of Pseudoplastic Semiliquid Foods
Mark D. Normand and Micha Peleg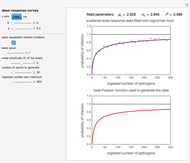 Pathogen Dose-Response Curves with the Beta Poisson and Lognormal Models
Mark D. Normand and Micha Peleg Simulating Ascorbic Acid Degradation
Mark D. Normand and Micha Peleg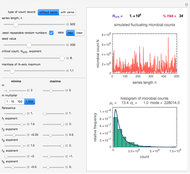 Simulating Microbial Count Records with an Expanded Fermi Solution Model
Mark D. Normand and Micha Peleg
-
 Ratkowski's Square Root Growth Rate Model for High Temperatures
Micha Peleg -
Gordon-Taylor and Fox Equations for Glass Transition Temperature
Micha Peleg -
 Force to Overcome Vacuum Pull
Micha Peleg -
 Extending the Square Root Growth Rate Model to Lethal Low Temperatures
Micha Peleg -
 Probability of Being Strange According to Paulos
Micha Peleg -
 Successive Three-Point Method for Weibullian Chemical Degradation
Micha Peleg -
 Estimating Cohesion and Tensile Strength of Compacted Powders
Micha Peleg -
 Three-Endpoints Method for Isothermal Weibullian Chemical Degradation
Micha Peleg -
 Vitamin C Loss in Foods During Heat Processing and Storage
Micha Peleg -
 Parameterizing Temperature-Viscosity Relations
Micha Peleg -
 Laplace Distribution in Fluctuating Stock Index Records
Micha Peleg -
 Weibullian Chemical Degradation
Micha Peleg -
Simulating Ascorbic Acid Degradation
Micha Peleg -
 Additive and Multiplicative Risks
Micha Peleg -
 Endpoints Method for Predicting Chemical Degradation in Frozen Foods
Micha Peleg -
 Exponential Model for Arrhenius Activation Energy
Micha Peleg -
 Prediction of Isothermal Degradation by the Endpoints Method
Micha Peleg -
 Risk Guesstimation from Factor Ranges
Micha Peleg -
 Volatiles Formation Kinetics in Stored Fish
Micha Peleg -
 Comparison of Six Sigmoid Growth Curve Models
Micha Peleg