Spatio-Temporal Epidemic Spread

Requires a Wolfram Notebook System
Interact on desktop, mobile and cloud with the free Wolfram Player or other Wolfram Language products.
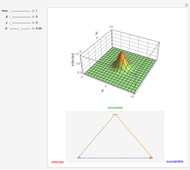
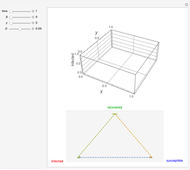
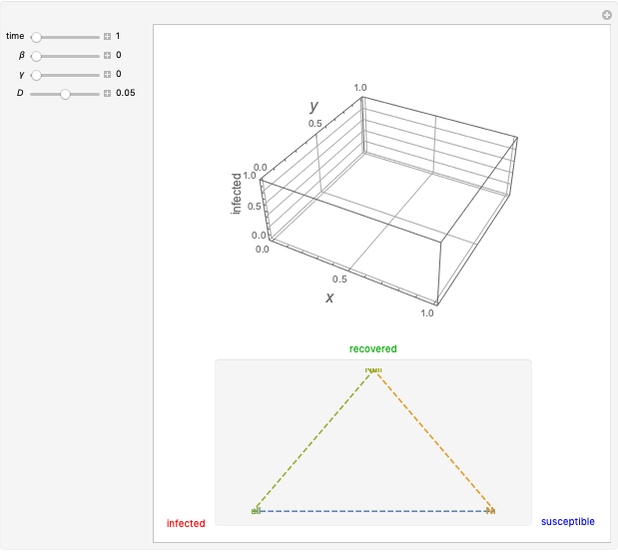
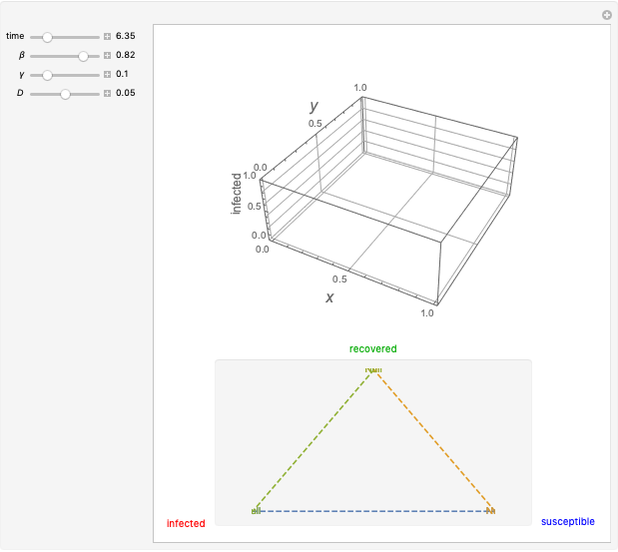
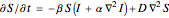
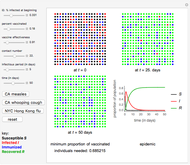
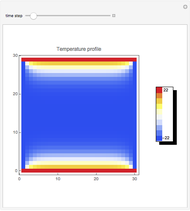
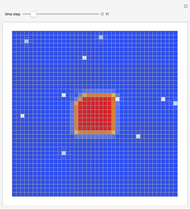
This Demonstration shows the spatio-temporal propagation of an epidemic that starts in the center of a square that contains a homogeneous population. The triangle at the bottom shows the ratio between susceptible, infected, and recovered individuals. Depending on the ratios between the contact rate  , the recovery rate
  , and the mobility of the individuals
  , the disease either propagates through the space or fades away. For a given instant in time, the 3D plot illustrates the proportion of infected individuals as a function of
  and
and  .
.
Contributed by: Jan Baetens (July 2013)
Open content licensed under CC BY-NC-SA
Snapshots


Details
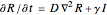
This model is a spatial extension of the well-established SIR-type epidemiological models that account for the dispersal rate  , contact rate , recovery rate , and the mobility of the individuals . As such, it provides far more realistic simulations of in natura disease outbreaks than the classical epidemiological models that have become well established since the work of Kermack and McKendrick (1927). The model equations are given by:

Snapshots 1–4 show the spatio-temporal evolution of the proportion of infected individuals for a parameter setting that allows the epidemic wave to propagate across the region.
References
[1] W. O. Kermack and A. G. McKendrick, "A Contribution to the Mathematical Theory of Epidemics," Proceedings of the Royal Society London A, 115(772), 1927 pp. 700–721. dx.doi.org/doi:10.1098/rspa.1927.0118.
[2] J. D. Murray, Mathematical Biology II: Spatial Models and Biomedical Applications, 3rd ed., Berlin: Springer, 2003.
Permanent Citation
 Vaccinations and Herd Immunity Using the SIR Disease Epidemic Model
Tara Nenninger and Soumyaa Mazumder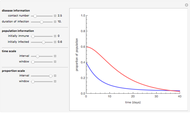 SIR Epidemic Dynamics
Steve Strain (Department of Biology, Slippery Rock University of Pennsylvania) Spread of Zika in Brazil Using the Ross-MacDonald Model
Jessica Lu and John Kwak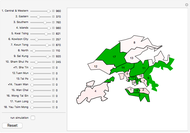 Dynamical Network Design for Controlling Virus Spread
Mengran Xue, Yan Wan, Sandip Roy, and Ali Saberi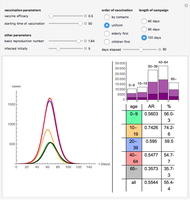 Dynamic Model of Pandemic Influenza with Age Structure and Vaccination
Diana Hulman-Knipl, Adam Hulman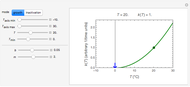 Square Root Model for Rates of Microbial Growth or Inactivation
Mark D. Normand and Micha Peleg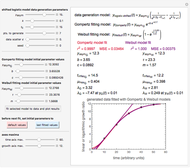 Lag Time in Microbial Growth
Mark D. Normand and Micha Peleg A Model of Plasmodium Falciparum Population Dynamics in a Patient during Treatment with Artesunate
Sompob Saralamba Degrees of Microbial Injury and Survival
Mark D. Normand and Micha Peleg Predator-Prey Equations Simulating an Immune Response
Clay Gruesbeck
-
 A Cellular Automaton-Based Heat Equation
Jan Baetens -
 Spatio-Temporal Epidemic Spread
Jan Baetens -
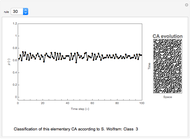 Sensitivity of Elementary Cellular Automata to Their Inputs
Jan Baetens -
 Mimicking the Kuramoto-Sivashinsky Equation Using Cellular Automaton
Jan Baetens -
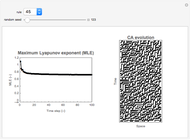 Lyapunov Exponents of Elementary Cellular Automata
Jan Baetens -
 Greenberg-Hastings Model
Jan Baetens