The Hodgkin-Huxley Experiment on Neuron Conductance


Requires a Wolfram Notebook System
Interact on desktop, mobile and cloud with the free Wolfram Player or other Wolfram Language products.
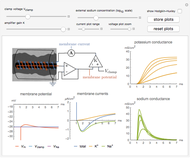
The Hodgkin–Huxley experiment measured the membrane conductances of sodium and potassium ions in the giant axon of the squid Loligo. This Demonstration reproduces the essentials of the original experimental procedure:
[more]
Contributed by: Oliver K. Ernst (July 2015)
Open content licensed under CC BY-NC-SA
Snapshots
Details
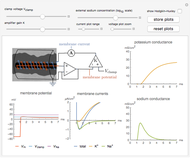
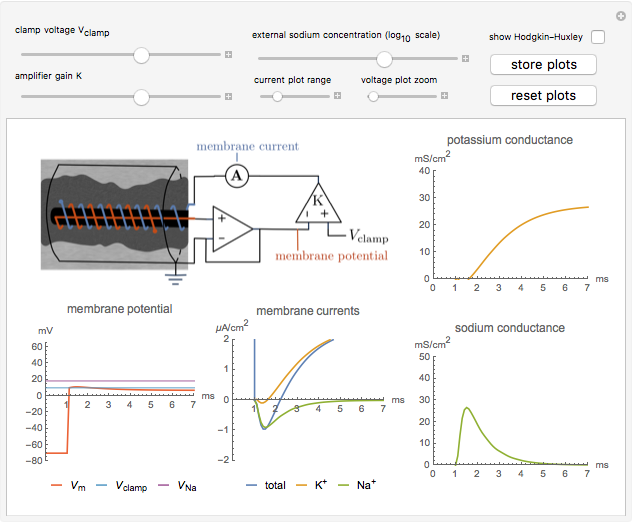
Snapshot 1: the sodium and potassium conductances can be determined following the experimental procedure of Hodgkin, Huxley, and Katz
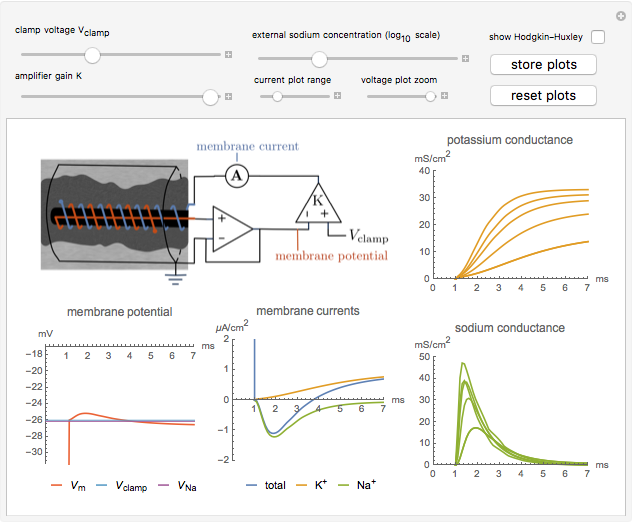
Snapshot 2: the dependence of the conductances on the magnitude of the voltage step and gain of the clamp circuit can be explored
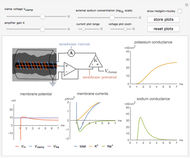
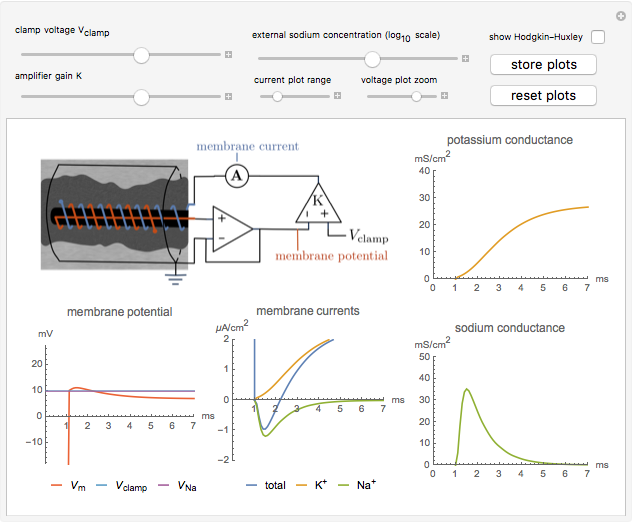
Snapshot 3: the Hodgkin–Huxley model of the ionic conductances can be shown to validate the theory
The Hodgkin–Huxley neuron model is a seminal discovery in neuroscience and electrophysiology. It describes the ionic currents and resulting voltage changes that occur across a neuron's membrane. Practically, it was developed by measuring the membrane conductance of sodium and potassium ions in the giant axon of the squid Loligo, from which the governing differential equations are deduced. The essential procedure of the original experiment [1, 2] is described below.
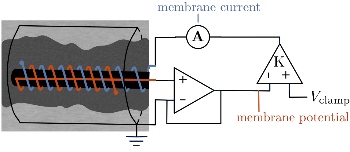
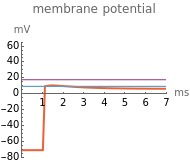
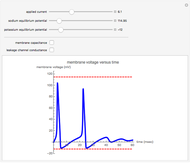
1. A voltage and current electrode, wrapped in a glass capillary, are inserted in the giant axon (0.1 to 1 mm diameter) as shown in the diagram. The axon itself is held in place in a grounded cylinder, originally made of silver sheet. The potential across the membrane is stepped and held at a constant value using a voltage clamp [1].
The high impedance op-amp draws minimal current from the membrane, and roughly outputs the membrane voltage  . The amplifier has an adjustable gain
  , and outputs voltage
  . The resultant current is applied across the membrane using the current electrode, leading to a feedback circuit that at high gain fixes the membrane voltage
  [3].
[3].
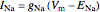
When the potential across the membrane is constant, the sum of the ionic currents must be balanced by the current applied by the voltage clamp. Thus, the measured current applied by the clamp  is the same magnitude as the total ionic current across the membrane (and opposite in sign). The total ionic current is divided into three components:
  ,
,  , and leak (other ions).
2. Next, in a separate experiment, the components of the total current are determined. The extracellular sodium concentration is adjusted such that sodium current does not occur [2], given by
 ,
,
where  is the Nernst reversal potential. Clearly,
  at
at  .
.
The reversal potential is given by
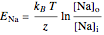 ,
,
where  and
and  denote the variable extracellular and fixed intracellular concentrations,
  is the charge of
  and
and  , and
, and  at 37° C [3].
When  , as can be seen in the lower-left panel, the sodium current disappears. Since the leak and capacitive currents occur on a short timescale much less than 1 ms (seen in the blue spike at 1 ms in the bottom-middle panel), principally only the potassium current remains. The measured total current is now
  , shown in orange. The sodium current is obtained as
  , with
  from step 1, shown in green.
3. Once the ionic currents have been determined, the conductances are given by
 ,
,
and similarly for  [3].
[3].
The time-dependent behavior of the conductances is explained by the transitions of activation and inactivation particles  ,
,
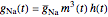 ,
,
 ,
,
where the particle dynamics are described by
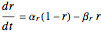
for  , and where
  ,
,  are transition rates between open and closed states. For further information, see [3, 4].
The true conductances may be shown on the plots for validation of the theory. Combined with the dynamics of the membrane voltage,
 ;
;
these equations constitute the Hodgkin–Huxley model [3, 4].
References
[1] A. L. Hodgkin, A. F. Huxley, and B. Katz, "Measurement of Current-Voltage Relations in the Membrane of the Giant Axon of Loligo," The Journal of Physiology, 116(4), 1952 pp. 424–448. doi:10.1113/jphysiol.1952.sp004716.
[2] A. L. Hodgkin and A. F. Huxley, "Currents Carried by Sodium and Potassium Ions through the Membrane of the Giant Axon of Loligo," The Journal of Physiology, 116(4), 1952 pp. 449-472. doi:10.1113/jphysiol.1952.sp004717.
[3] C. Koch, Biophysics of Computation: Information Processing in Single Neurons, New York: Oxford University Press, 1999.
[4] A. L. Hodgkin and A. F. Huxley, "A Quantitative Description of Membrane Current and Its Application to Conduction and Excitation in Nerve," The Journal of Physiology, 117(4), 1952 pp. 500–544. doi:10.1113/jphysiol.1952.sp004764.
Permanent Citation
 Minimal Hodgkin-Huxley Model: DC Stimulus
Qurat-ul-Ann (Anna) Mirza and Yogesh Joglekar Two-Dimensional Sodium plus Potassium Neuron Model
Joshua Ryan and Jan Fiala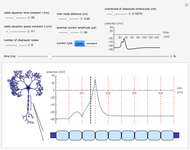 Action Potential Propagation along Myelinated Axons
Oliver K. Ernst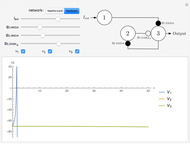 Feedforward and Feedback Control in Neural Networks
Oliver K. Ernst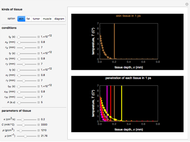 Tissue Heat Conduction in Millisecond-Picosecond Range
Muhamad Hamdi and Yusof Munajat Tissue Heat Conduction in Millisecond-Picosecond Ranges
Muhamad Hamdi and Yusof Munajat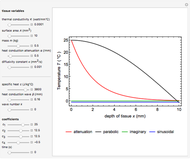 1D Heat Conduction through Biological Tissue
Muhamad Hamdi and Yusof Munajat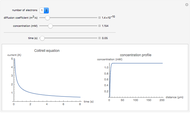 Cottrell Equation for the Potential-Step Experiment
Quang-Dao Trinh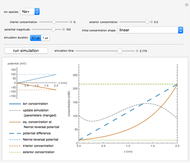 Electrodiffusion of Ions across a Neural Cell Membrane
Oliver K. Ernst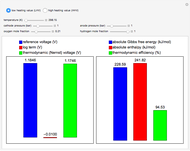 Thermodynamic Voltage and Efficiency of Hydrogen Fuel Cells
Mohammed S. Ismail
-
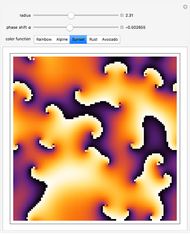 Pattern Formation in the Kuramoto Model
Oliver K. Ernst -
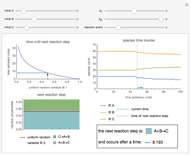 Gillespie's Stochastic Simulation Algorithm for Chemical Reactions
Oliver K. Ernst -
Electrodiffusion of Ions across a Neural Cell Membrane
Oliver K. Ernst -
Action Potential Propagation along Myelinated Axons
Oliver K. Ernst -
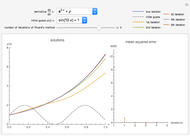 Picard's Method for Ordinary Differential Equations
Oliver K. Ernst -
 Distributions Using Slice Sampling
Oliver K. Ernst -
 The Hodgkin-Huxley Experiment on Neuron Conductance
Oliver K. Ernst -
 Tracking an Object in Space Using the Kalman Filter
Oliver K. Ernst -
Feedforward and Feedback Control in Neural Networks
Oliver K. Ernst