The Lorenz Curve


Requires a Wolfram Notebook System
Interact on desktop, mobile and cloud with the free Wolfram Player or other Wolfram Language products.
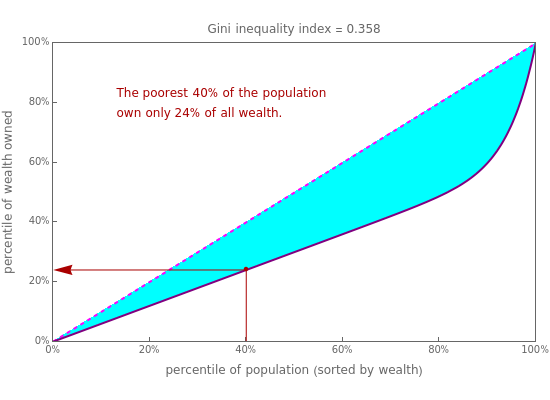
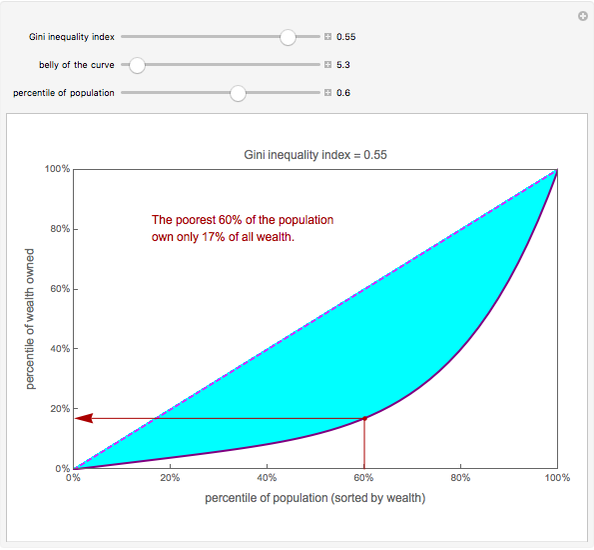
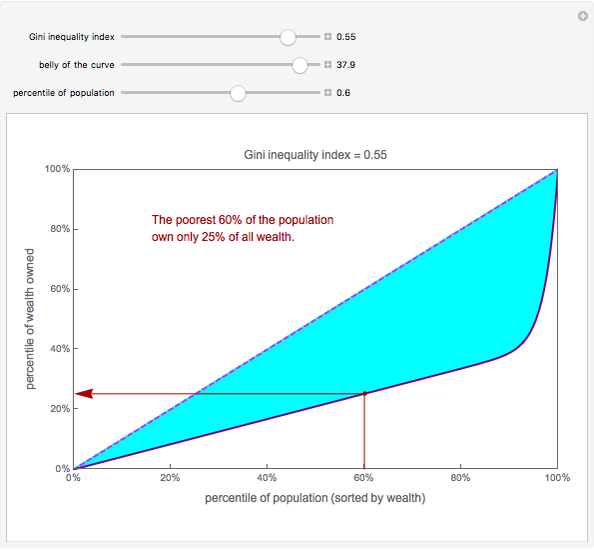
A Lorenz curve plots the cumulative percentages of total wealth owned against the cumulative number of individuals in a country, starting from the poor and going to the rich. The Gini index measures the area between the Lorenz curve and a hypothetical line of absolute equality, expressed as a fraction of the maximum area under the line. Thus a Gini index of 0 represents perfect equality, while an index of 1 represents perfect inequality. Use the sliders in this Demonstration to see that different Lorenz curves can have the same Gini index and to see what each point in a given Lorenz curve means in terms of the percentage of wealth owned by the poorest.
Contributed by: José Luis Gómez-Muñoz (June 2014)
Open content licensed under CC BY-NC-SA
Snapshots


Details
Reference
[1] CIA, "Country Comparison: Distribution of Family Income—Gini Index," in The World Factbook 2013–2014, Washington, DC: Central Intelligence Agency, 2013. www.cia.gov/library/publications/the-world-factbook/rankorder/2172rank.html.
Permanent Citation
"The Lorenz Curve"
http://demonstrations.wolfram.com/TheLorenzCurve/
Wolfram Demonstrations Project
Published: June 2 2014
 The Lorenz Curve and Various Economic Indices
Shreyas S. Gandlur and Craig Soares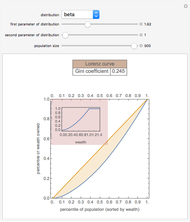 Lorenz Curves and the Gini Coefficient
Seth J. Chandler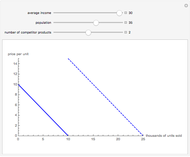 Shifts in the Demand Curve
Sarah Lichtblau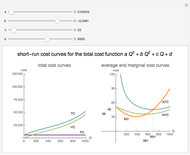 Short-Run Cost Curves
William J. Polley Short-Run Production and Cost Curves
Tom Creahan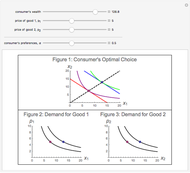 Cobb-Douglas Utility Function
Francisco José Espinosa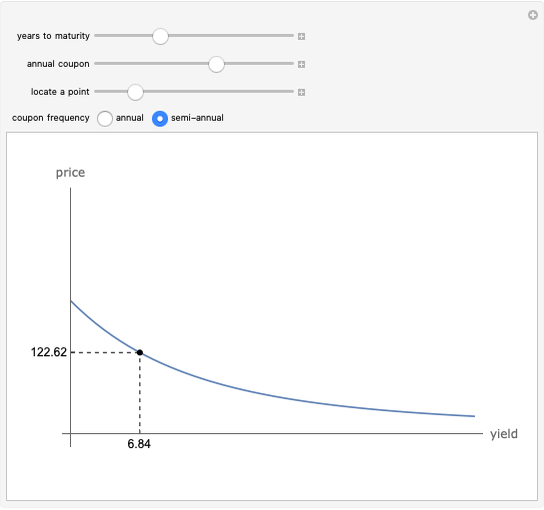 Price-Yield Curve
Fiona Maclachlan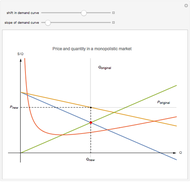 No Supply Curve in a Monopolistic Market
Samuel G. Chen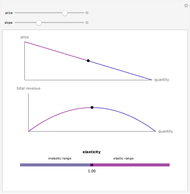 Elasticity, Total Revenue, and the Linear Demand Curve
Fiona Maclachlan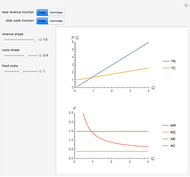 Revenue and Costs Curves Analysis
Timur Gareev
-
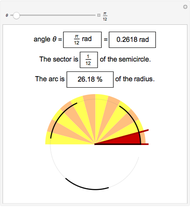 Radians as Percentages
José Luis Gómez-Muñoz -
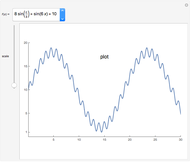
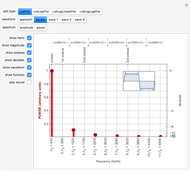 Logarithmic Scales in Acoustic Spectra: Decibels and Octaves
José Luis Gómez-Muñoz -
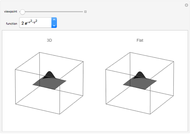
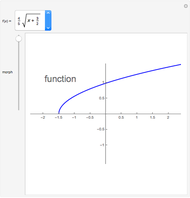 Morphing the Graph of a Function to Its Domain
José Luis Gómez-Muñoz -
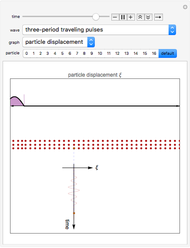 Traveling Longitudinal Pulses and Standing Waves
José Luis Gómez-Muñoz -
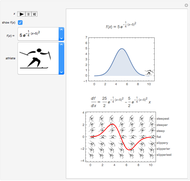 Differentiation for Athletes
José Luis Gómez-Muñoz -
 Morphing from Plot to Log Plot
José Luis Gómez-Muñoz -
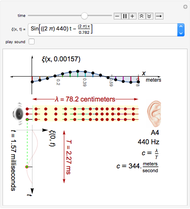 Properties of Acoustic Plane Waves
José Luis Gómez-Muñoz -
 The Lorenz Curve
José Luis Gómez-Muñoz -
 Learn the Game of Go
José Luis Gómez-Muñoz -
 Anamorphic 2D Images That Look Three-Dimensional from a Particular Viewpoint
José Luis Gómez-Muñoz -
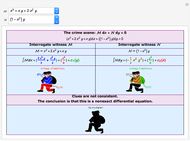 The Murder Mystery Method for Identifying and Solving Exact Differential Equations
José Luis Gómez-Muñoz -
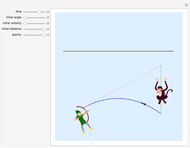 Parabolic Projectile Motion: Shooting a Harmless Tranquilizer Dart at a Falling Monkey
José Luis Gómez-Muñoz -
 Molecular Dynamics of Lennard-Jones Particles Using the Velocity Verlet Algorithm
José Luis Gómez-Muñoz -
 Sailing against the Wind
José Luis Gómez-Muñoz