Tilley's Bundling Algorithm


Requires a Wolfram Notebook System
Interact on desktop, mobile and cloud with the free Wolfram Player or other Wolfram Language products.
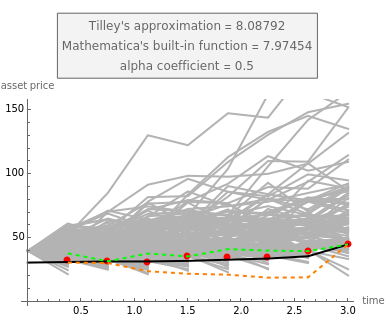
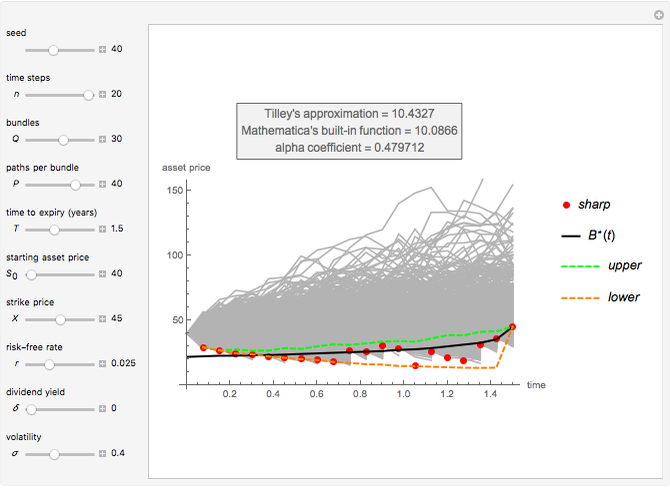
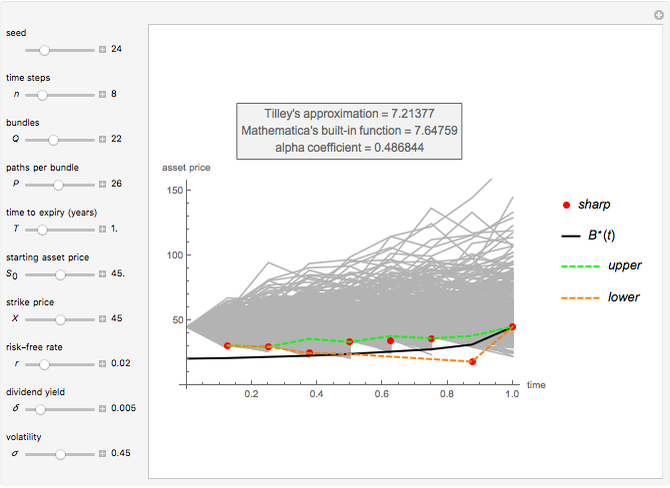
This Demonstration shows Tilley's bundling algorithm [1] that uses Monte Carlo simulation to approximate the value of an American option on a single underlying asset. The graph shows the simulated geometric Brownian motion (GBM) paths (gray lines), the "transition zone" (dashed lines), and the "sharp boundary" (red dots), which is the algorithm's approximation for the optimal exercise boundary  (black line). Whenever a GBM path falls below the "sharp boundary", the early-exercise is considered optimal and the option is instantly exercised. The early-exercise events at each time step are illustrated by the abrupt cut of those GBM paths that fall bellow the red dots. For each GMB path, the intrinsic value of the option at the time of exercise is discounted, and Monte Carlo integration helps to approximate the American put at
  .
.
Contributed by: Michail Bozoudis (October 2014)
Suggested by: Michail Boutsikas
Open content licensed under CC BY-NC-SA
Snapshots


Details
Tilley's bundling algorithm [1] is a Monte Carlo simulation approach [2] for pricing American options. It generates pseudorandom paths that follow GBM and estimates the option’s continuation value by using backwards induction and a bundling technique. At one time step prior to maturity, paths whose stock prices are similar are grouped together to obtain an estimate of the one-period-ahead option value. Proceeding recursively from the option’s expiration date, an optimal exercise policy is obtained. The red dots represent Tilley's "sharp boundary", which is the algorithm's approximation of . The (actual) early-exercise boundary derives from Mathematica's built-in function FinancialDerivative. While the stock price moves above , the early-exercise is not optimal because the option's holding value is greater than its intrinsic value.
Tilley's "sharp boundary" lies within a "transition zone", which is determined by the dashed lines in the graph: • between the zone's upper limit and the "sharp boundary", the possibility of early-exercise is significantly low, • between the "sharp boundary" and the zone's lower limit, the possibility of early-exercise is significantly high, • outside the "transition zone", the early-exercise possibilities are considered 0% and 100%, respectively.
The "alpha" coefficient derives from  , where
  is the number of paths per bundle, and
  is the total number of paths.
•
is the total number of paths.
•  indicates that the simulation algorithm uses a single bundle that includes all paths,
•
indicates that the simulation algorithm uses a single bundle that includes all paths,
•  indicates that every single path is treated as a separate bundle,
•
indicates that every single path is treated as a separate bundle,
•  indicates that the number of bundles equals the number of paths per bundle. Tilley demonstrated that if
  , the algorithm still provides good approximations for American options, even if the simulation algorithm uses the upper limit of the "transition zone" as the early-exercise boundary.
References
[1] J. Tilley, "Valuing American Options in a Path Simulation Model," Transactions of the Society of Actuaries, 45, 1993 pp. 83–104.
[2] M. Fu, S. Laprise, D. Madan, Y. Su, and R. Wu, "Pricing American Options: A Comparison of Monte Carlo Simulation Approaches," Journal of Computational Finance, 4, 2001 pp. 39–88.
Permanent Citation
 Pricing Put Options with the Trinomial Method
Michail Bozoudis Pricing Put Options with the Binomial Method
Michail Bozoudis Kim's Method for Pricing American Options
Michail Bozoudis A Recursive Integration Method for Options Pricing
Michail Bozoudis A Canonical Optimal Stopping Problem for American Options
Michail Bozoudis Pricing American Options with the Lower-Upper Bound Approximation (LUBA) Method
Michail Bozoudis American Options on Assets with Dividends Near Expiry
Michail Bozoudis Geske-Johnson Method
Michail Bozoudis Maximizing a Bermudan Put with Two Early-Exercise Temporal Points
Michail Bozoudis Kim's Method with Nonuniform Time Grid for Pricing American Options
Michail Bozoudis
-
 Fitting Times-to-Failure to a Weibull Distribution
Michail Bozoudis -
A Canonical Optimal Stopping Problem for American Options
Michail Bozoudis -
A Recursive Integration Method for Options Pricing
Michail Bozoudis -
 Adaptive Mesh Relocation-Refinement (AMrR) on Kim's Method for Options Pricing
Michail Bozoudis -
Kim's Method with Nonuniform Time Grid for Pricing American Options
Michail Bozoudis -
 Geometric Brownian Motion with Nonuniform Time Grid
Michail Bozoudis -
Kim's Method for Pricing American Options
Michail Bozoudis -
 Simultaneous Confidence Interval for the Weibull Parameters
Michail Bozoudis -
 Binomial Black-Scholes with Richardson Extrapolation (BBSR) Method
Michail Bozoudis -
Pricing American Options with the Lower-Upper Bound Approximation (LUBA) Method
Michail Bozoudis -
American Options on Assets with Dividends Near Expiry
Michail Bozoudis -
 Hold-or-Exercise for an American Put Option
Michail Bozoudis -
 American Capped Call Options with Exponential Cap
Michail Bozoudis -
 American Capped Call Options with Constant Cap
Michail Bozoudis -
 Pricing Put Options with the Crank-Nicolson Method
Michail Bozoudis -
 Pricing Put Options with the Implicit Finite-Difference Method
Michail Bozoudis -
 Estimating a Distribution Function Subject to a Stochastic Order Restriction
Michail Bozoudis -
 Maximizing a Bermudan Put with a Single Early-Exercise Temporal Point
Michail Bozoudis -
 Fitting Data to a Lognormal Distribution
Michail Bozoudis -
 SARIMA Process Forecasting Model
Michail Bozoudis