Visualizing Higher-Dimensional Data with 3D Scatterplots


Requires a Wolfram Notebook System
Interact on desktop, mobile and cloud with the free Wolfram Player or other Wolfram Language products.
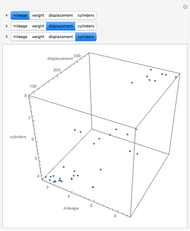
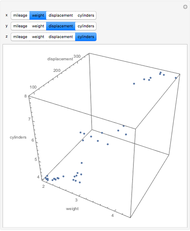
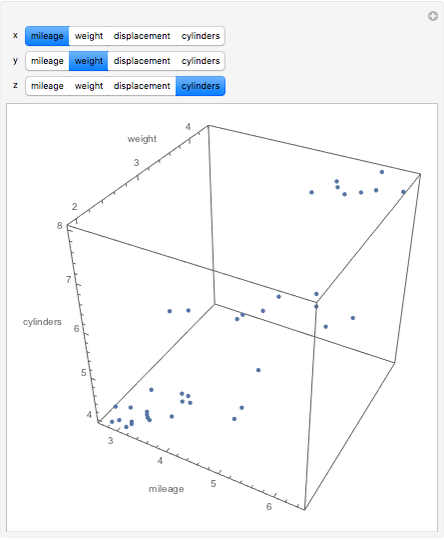
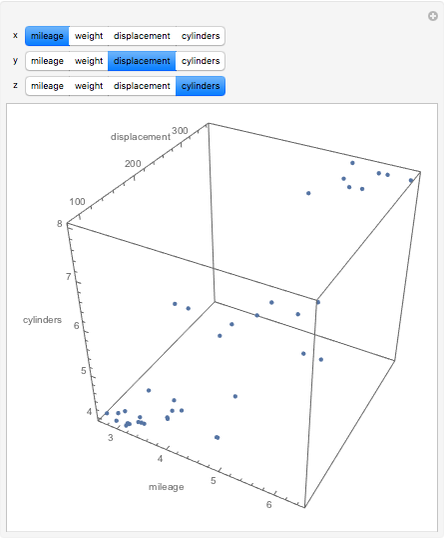
This Demonstration visualizes some four-dimensional data using three-dimensional scatterplots. The data is a random sample of 38 automobiles with four variables: mileage (gallons per mile), weight, displacement, and number of cylinders. There are four possible distinct combinations of interest (mileage-weight-displacement, mileage-weight-cylinders, etc.). Drag to rotate the plot. How does mileage depend on the other variables? Do you think the relationship is approximately linear?
Contributed by: Ian McLeod (October 2013)
Open content licensed under CC BY-NC-SA
Snapshots


Details
The data is given in [1]. The method given here is reasonable for  dimensions, but as
  increases, the number of combinations of variables rapidly increases and so other methods are needed. In [2] methods are discussed for projecting high-dimensional data into three dimensions and then using a 3D scatterplot along with dynamic graphics methods for brushing and linking.
References
[1] B. Abraham and J. Ledholter, Introduction to Regression Modeling, Belmont, CA: Brooks/Cole, 2006.
[2] D. Cook and D. F. Swayne, Interactive and Dynamic Graphics for Data Analysis, New York: Springer, 2007.
Permanent Citation
"Visualizing Higher-Dimensional Data with 3D Scatterplots"
http://demonstrations.wolfram.com/VisualizingHigherDimensionalDataWith3DScatterplots/
Wolfram Demonstrations Project
Published: October 23 2013
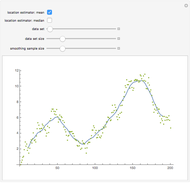 Data Smoothing
Jon McLoone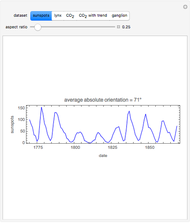 Choosing the Aspect Ratio
Ian Mcleod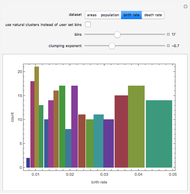 Grouping Country Data
Seth J. Chandler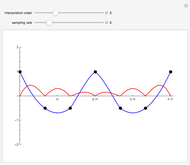 Data Sampling and Interpolation
Brian Van Vertloo Chaotic Data: Correlation Dimension
Heikki Ruskeepää Rasterization of a Data Plot
Paul van der Schaaf Edgeworth Expansion for Near-Normal Data
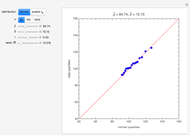
Housam Binous, Mamdouh Al-Harthi, and Brian G. Higgins Fitting Data to a Lognormal Distribution
Michail Bozoudis Comparing Regression Models with and without Data Transformation
Vincent Shatlock and Autar Kaw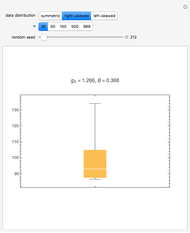 Exploring Skewness in Box Plots
Ian McLeod
-
 Rank Transform in Harmonic Regression Time Series
Ian McLeod -
 Detecting Periodicity in Short Time Series
Ian McLeod -
 Tempered Fractionally Differenced White Noise
Ian McLeod -
 Regression toward the Mean
Ian McLeod -
 Spread-Location Regression Diagnostic Check
Ian McLeod -
 Anscombe Quartet
Ian McLeod -
 Visualizing Higher-Dimensional Data with 3D Scatterplots
Ian McLeod -
 Mean, Fitted-Value, Error, and Residual in Simple Linear Regression
Ian McLeod -
 Estimating and Diagnostic Checking in Censored Normal Random Samples
Ian McLeod -
 Comparing Gamma and Log-Normal Distributions
Ian McLeod -
 Monte Carlo Expectation-Maximization (EM) Algorithm
Ian McLeod -
 Comparing Exact and Approximate Censored Normal Likelihoods
Ian McLeod -
 Transformation to Symmetry of Gamma Random Variables
Ian McLeod -
 Illustrating the Central Limit Theorem with Sums of Bernoulli Random Variables
Ian McLeod -
 Hidden Correlation in Regression
Ian McLeod -
 Informal Power Assessment of the Normal Probability Plot
Ian McLeod -
 Time Series for Power-Law Decay
Ian McLeod -
 Block Bootstrap for Time Series
Ian McLeod -
 Fractional Gaussian Noise
Ian McLeod -
 Plotting a Long Time Series
Ian McLeod