Wigner Distribution Function for Harmonic Oscillator


Requires a Wolfram Notebook System
Interact on desktop, mobile and cloud with the free Wolfram Player or other Wolfram Language products.
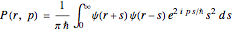
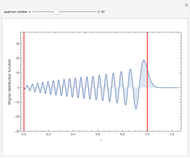
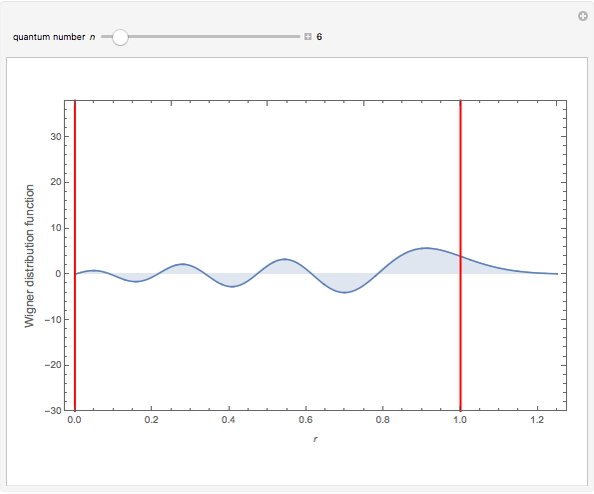
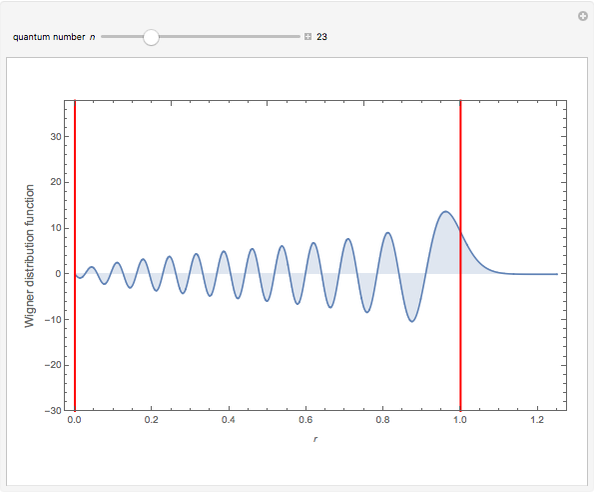
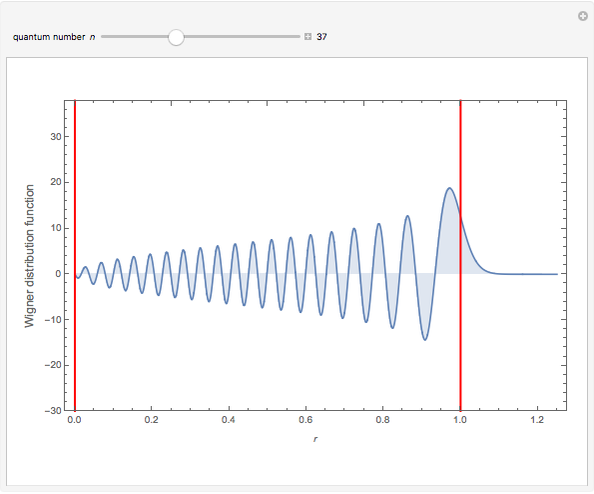
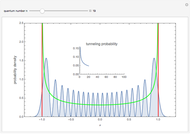
This Demonstration shows the Wigner quasiprobability distribution for 101 energy states of the quantum harmonic oscillator. Units are chosen so that the energy operator is simplified to
[more]


Contributed by: Arkadiusz Jadczyk (January 2015)
Open content licensed under CC BY-NC-SA
Snapshots
Details
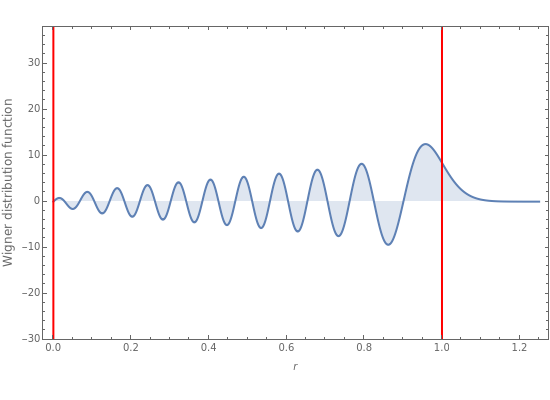
The vertical red line at  indicates the classical turning point. Beyond this point is the classically forbidden region. The area under the plot to the right of this line is the quasiprobability of the nonclassical quantum tunneling behavior. For
  , this area is between 0.37 and 0.33. Yet, owing to the nonpositivity of the Wigner distribution, the meaning of these numbers is open to interpretation.
References
[1] Wikipedia. "Wigner Quasiprobability Distribution." (Jan 22, 2015) en.wikipedia.org/wiki/Wigner_quasiprobability_distribution.
[2] Wikipedia. "Quantum Harmonic Oscillator." (Jan 22, 2015) en.wikipedia.org/wiki/Quantum_harmonic_oscillator.
Permanent Citation
 Quantum Harmonic Oscillator Tunneling into Classically Forbidden Regions
Arkadiusz Jadczyk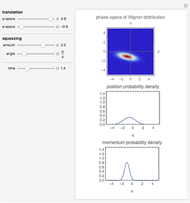 Time Evolution of Squeezed Quantum States of the Harmonic Oscillator
Arkadiusz Jadczyk Harmonic Oscillator Eigenfunctions
Michael Trott Harmonic Oscillator Wavefunctions
Richard Gass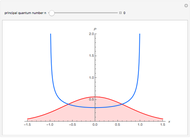 Quantum/Classical Correspondence for the Harmonic Oscillator
Niels Walet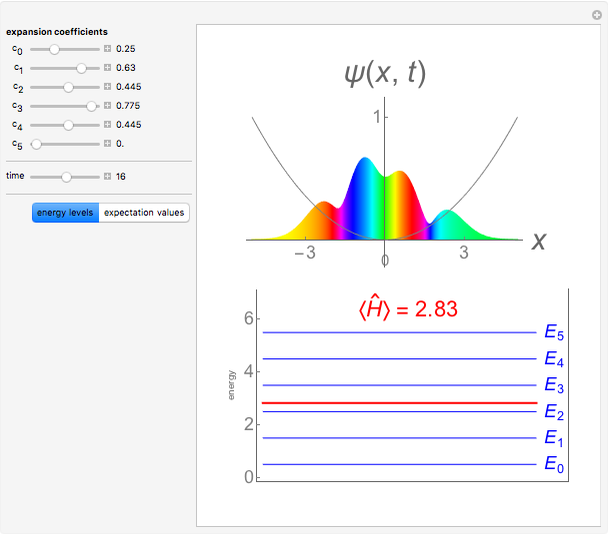 Time-Dependent Superposition of Harmonic Oscillator Eigenstates
Porscha McRobbie and Eitan Geva Causal Interpretation of the Quantum Harmonic Oscillator
Klaus von Bloh Superposition of Quantum Harmonic Oscillator Eigenstates: Expectation Values and Uncertainties
Porscha McRobbie and Eitan Geva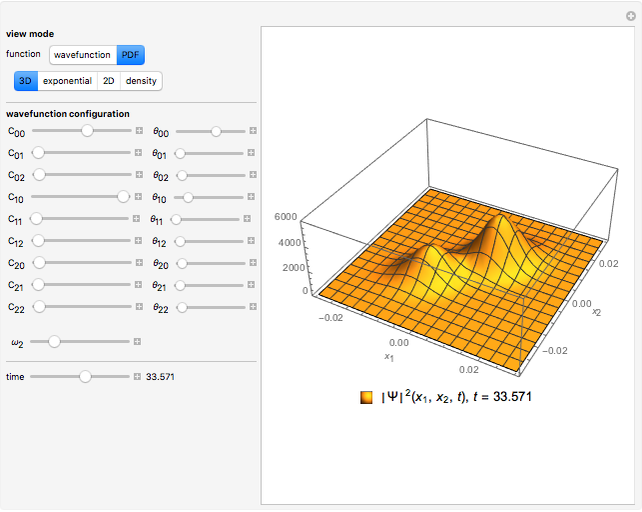 Coupled Quantum Harmonic Oscillators
Humberto Munoz Bauza Harmonic Oscillator in a Half-space with a Moving Wall
Michael Trott
-
 Dzhanibekov Effect
Arkadiusz Jadczyk -
Time Evolution of Squeezed Quantum States of the Harmonic Oscillator
Arkadiusz Jadczyk -
 Quantum Octahedral Fractal via Random Spin-State Jumps
Arkadiusz Jadczyk -
 Wigner Distribution Function for Harmonic Oscillator
Arkadiusz Jadczyk -
Quantum Harmonic Oscillator Tunneling into Classically Forbidden Regions
Arkadiusz Jadczyk