Cobweb Diagram of the Logistic Map
Initializing live version

Requires a Wolfram Notebook System
Interact on desktop, mobile and cloud with the free Wolfram Player or other Wolfram Language products.
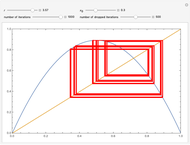
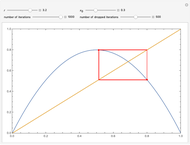
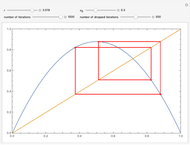
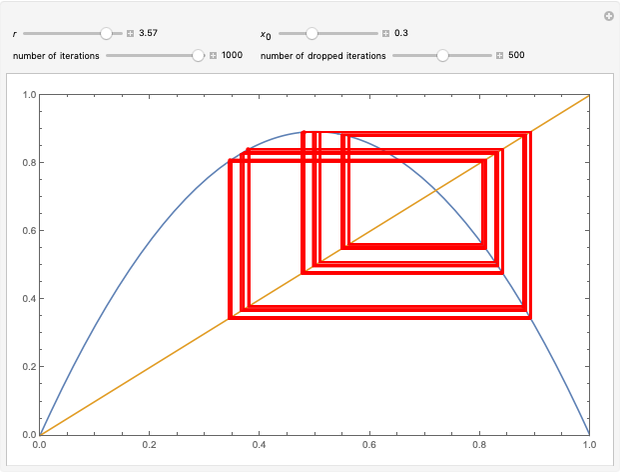
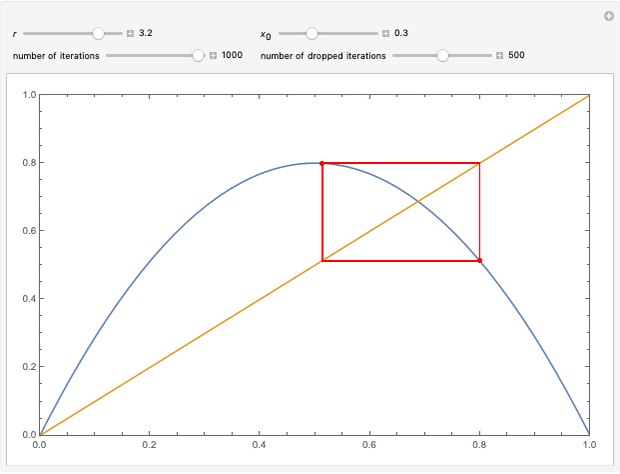
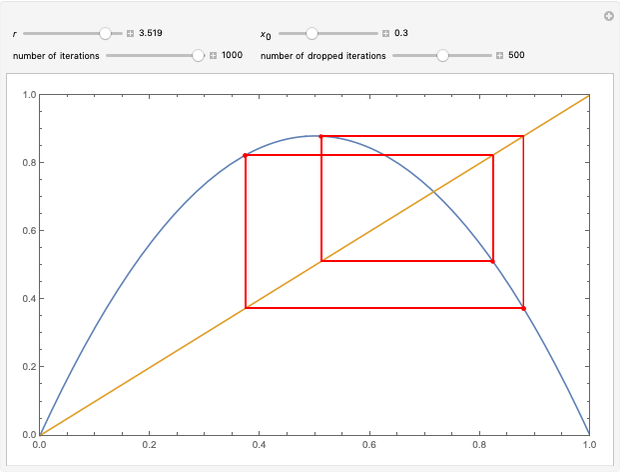
The logistic map, a popular example of a period-doubling cascade developing to chaos, obeys the recurrence 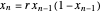 . The red cobweb diagram traces out the orbit of
  for a given value of the parameter
  . The orbit is chaotic when the cobweb diagram becomes dense.


Contributed by: Kevin Reiss (May 2021)
Open content licensed under CC BY-NC-SA
Snapshots
Details
Snapshot 1: period 2 orbit
Snapshot 2: period 4 orbit
Snapshot 3: chaotic orbit
Permanent Citation
Related Demonstrations
More by Author
 Binary Coding Functions for Generalized Logistic Maps with z-Unimodality
Ki-Jung Moon Iterates of Generalized Logistic Maps for Superstable Parameter Values
Ki-Jung Moon Variations of the Gingerbreadman Map
Erik Mahieu The Sawtooth Standard Map
Enrique Zeleny Playing with the Hénon Map Starting with a Circle or a Square
Ki-Jung Moon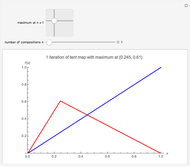 Entropy of n-Fold Compositions of the Tent Map
John Wells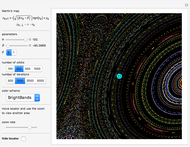 Martin's Map Artwork
Erik Mahieu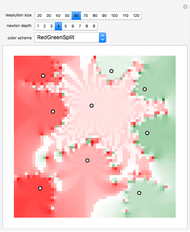 Complex Newton Map
Ed Pegg Jr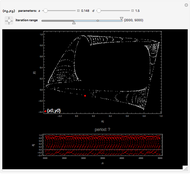 Iterations of Kaneko Map
Erik Mahieu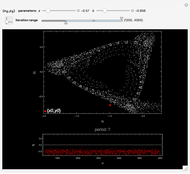 Iterations of Strick Map
Erik Mahieu