Deriving the Liquidity Preference-Money Supply (LM) Curve


Requires a Wolfram Notebook System
Interact on desktop, mobile and cloud with the free Wolfram Player or other Wolfram Language products.
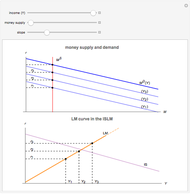
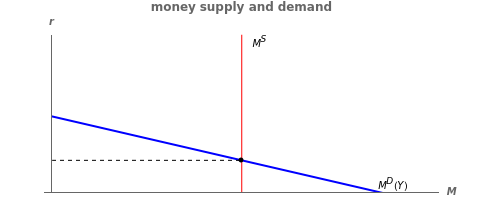
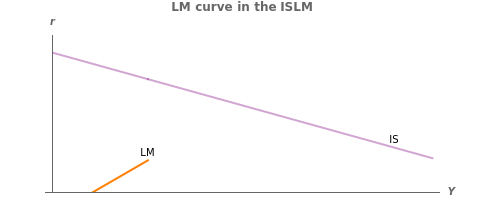
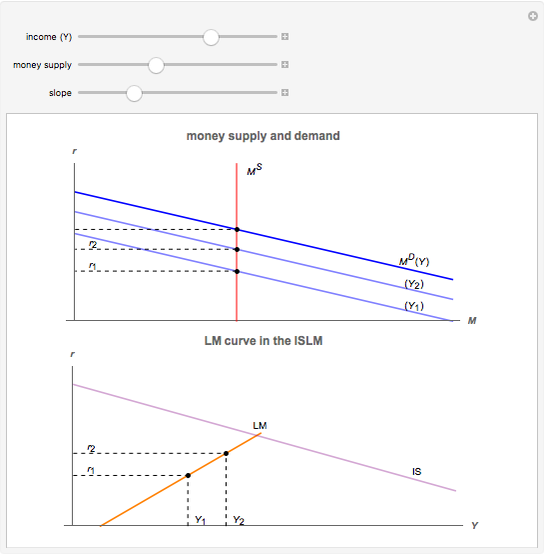
This Demonstration illustrates how the liquidity preference–money supply (or LM) curve is formed; the curve shows equilibrium points in the money market. In the money market, money supply is a fixed amount determined by the central bank, whereas money demand is a downward-sloping function  (interest rate) as a function of
  (income) and
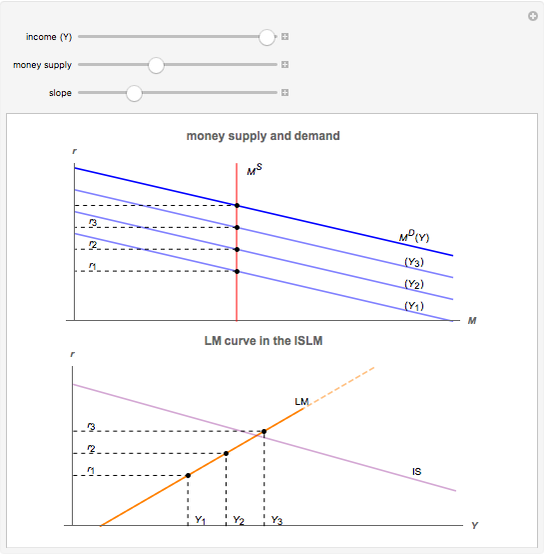
  (quantity of money). Money demand reflects people's demand for liquidity; at a higher rate of interest, which makes bonds more valuable, people choose to hold bonds instead of liquidity and vice versa for lower rates of interest. The intersection point between money supply and money demand, which corresponds to a certain interest rate and level of income, can be plotted as a point on the LM curve, which is the interest rate as a function of income. As income rises and the money demand curve shifts up, the successive equilibrium points in the money market are plotted along the LM curve.
Contributed by: Nicholas Palmer (June 2015)
Open content licensed under CC BY-NC-SA
Snapshots


Details
The LM curve represents half of the IS-LM model. Just as the LM curve shows equilibrium points in the money market, the IS curve, which is shown above, presents the equilibrium points in the goods market. Together, the IS and LM curves intersect at an equilibrium interest rate and level of output. This model was developed by John Hicks in 1937 to represent the macroeconomic ideas of John Maynard Keynes.
Shifting money supply shifts the entire LM curve. When a government engages in monetary policy, the central bank changes the level of money supply in order to move the LM curve, which affects equilibrium levels of output and the interest rate at the point where the LM curve intersects with the IS curve.
Reference
[1] J. R. Hicks, "Mr. Keynes and the 'Classics'; A Suggested Interpretation," Econometrica 5(2), 1937 pp. 147–159. doi:10.2307/1907242.
Permanent Citation
"Deriving the Liquidity Preference-Money Supply (LM) Curve"
http://demonstrations.wolfram.com/DerivingTheLiquidityPreferenceMoneySupplyLMCurve/
Wolfram Demonstrations Project
Published: June 8 2015
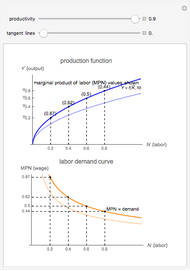 Deriving the Labor Demand Curve
Nicholas Palmer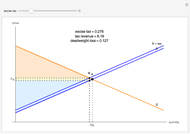 Supply and Demand Excise Tax
Nicholas Palmer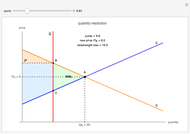 Supply and Demand Quantity Restriction
Nicholas Palmer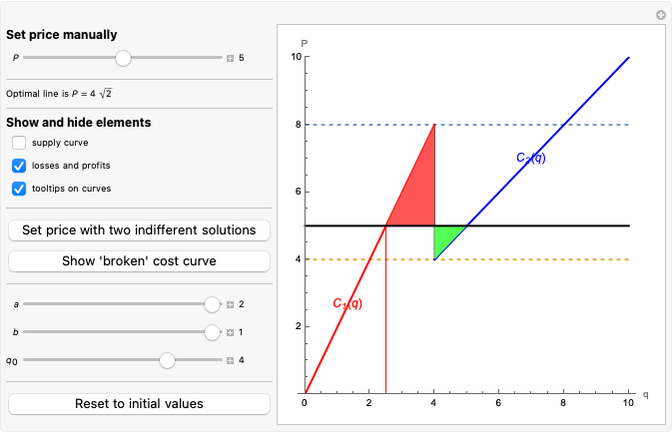 Supply Curve from Piecewise Linear Cost Function
Timur Gareev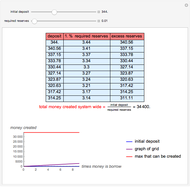 Money Creation in the Banking System
Alla Ahmad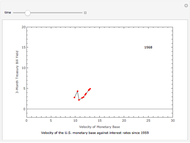 Spotting a Liquidity Trap
Samuel G. Chen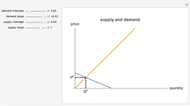 Basic Supply and Demand
Mark Gillis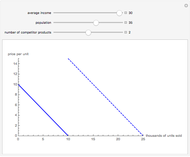 Shifts in the Demand Curve
Sarah Lichtblau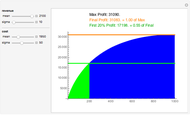 Customer Profitability with the Whale Curve
Thomas Laussermair Moral Hazard and Least-Cost Contracts: Impact of Changes in Agent Preferences
Randy Silvers (Deakin University)