Extending the Square Root Growth Rate Model to Lethal Low Temperatures


Requires a Wolfram Notebook System
Interact on desktop, mobile and cloud with the free Wolfram Player or other Wolfram Language products.
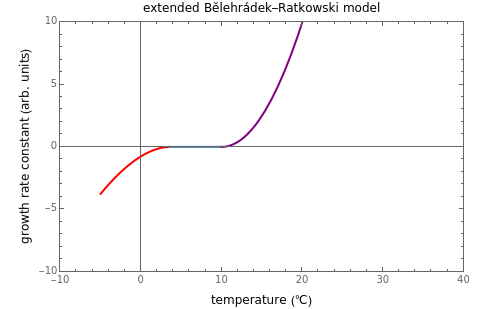
When the temperature of a microbial population is lowered beyond a certain level, its growth ceases and can become inactive. The phenomenon is reversed upon heating. The temperature effect on the growth rate above the minimal temperature needed for growth has been frequently described by Ratkowski's square root model, a simple, useful variant of the Bĕlehrádek model. This Demonstration provides graphical visualization of an extended version of these models in the region where growth ceases and turns into inactivation or vice versa. The extended model has been constructed by mirroring the temperature effect in the two regimes and allowing for an intermediate temperature range where the population size remains practically unchanged.
Contributed by: Mark D. Normand and Micha Peleg (May 2018)
Open content licensed under CC BY-NC-SA
Snapshots
Details
Snapshot 1: the growth rate's temperature dependence of a hypothetical bacterium according to the traditional square root model
Snapshot 2: the cold inactivation rate's temperature dependence of a hypothetical bacterium according to the extended model
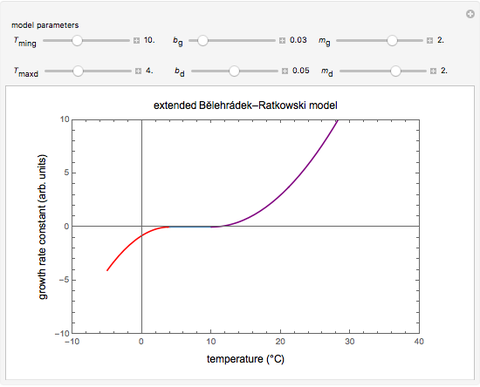
Snapshot 3: the temperature effect on the growth and inactivation rates of a hypothetical thermophilic bacterium
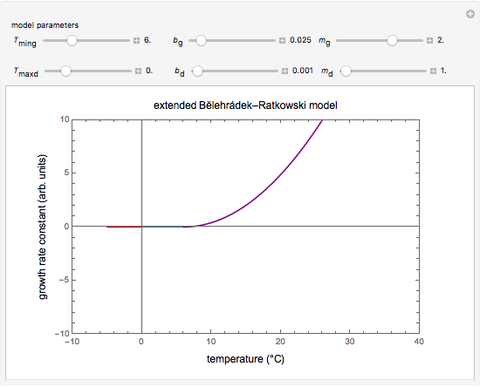
Snapshot 4: the temperature effect on the growth and inactivation rates of a hypothetical mesophilic bacterium
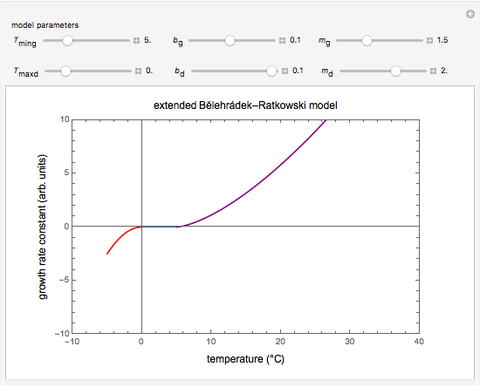
Snapshot 5: the temperature effect on the growth and inactivation of a hypothetical psychrophilic bacterium
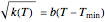
Ratkowski’s square root model was originally written in the form
 ,
,
where  is the growth rate parameter, usually the sigmoid isothermal growth curve’s slope at its inflection point,
  the temperature and
  the temperature below which growth ceases [1, 2]. The model can also be written in the general form:
If  ,
,
0.,
else  ,
,
where  can, but need not always, be equal to 2 [2–4]. Notice that without the added "If" statement, the original model's equation implies that at
  the rate constant rises if
  , or becomes a complex number if is a noninteger.
In reality, it can be expected that at temperatures below , growth not only ceases but turns into mortality, causing the population size to decrease. In terms of the model, at  , the growth rate
  changes sign and becomes negative, signifying inactivation.
For a qualitative account of such scenarios, we assume that the growth and inactivation regimes can be separated by a stationary region where for all practical purposes  , and that at least initially, the versus curve in the inactivation regime mirrors that in the growth regime, albeit with different parameters having different magnitudes. If these assumptions hold, a versus curve that describes all three regimes will have the form:
If  ,
,
 ,
,
else if  ,
,
,
else 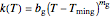 ,
,
where  and
and  ,
,  and
and  are the pairs of the decay and growth parameters, respectively, and
  and
and  mark the region where the population size remains practically unchanged.
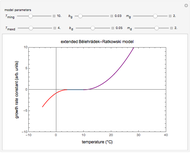
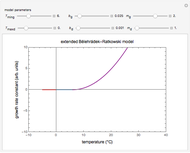
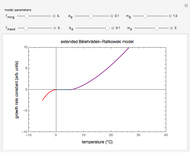
This Demonstration provides graphical visualization of the expanded version of the Bĕlehrádek–Ratkowski model in the transition region from growth to inactivation or vice versa with sliders to set the model parameters , , , , and .
Notice that in Ratkowski's original model is a special case of the expanded model where  ,
,  and
and  . Where ,
  and
and  , the model renders an inverted image of reminiscent of the shape of a curve following the log-logistic inactivation model.
The purpose of this Demonstration is only to illustrate the extended version of the Bĕlehrádek–Ratkowski model, not to match the behavior of any particular micro- or macroorganism [3]. Therefore, not all the parameter combinations allowed by the controls necessarily represent real-life growth/inactivation or inactivation/growth scenarios. Also, this Demonstration addresses only the growth/inactivation rate constant, ignoring the other kinetic parameters that account for the shape of the entire inactivation/growth curve [5].
References
[1] D. A. Ratkowski, J. Olley, T. A. McMeekin and A. Ball, "Relationship between Temperature and Growth Rate of Bacterial Cultures," Journal of Bacteriology, 149(1), 1982 pp. 1–5. jb.asm.org/content/149/1/1.full.pdf+html.
[2] T. Ross, "Bĕlehrádek-Type Models," Journal of Industrial Microbiology and Biotechnology, 12(3–5), 1993 pp. 180–189. doi:10.1007/BF01584188.
[3] J.-F. Briere, P. Pracros, A.-Y. Le Roux and J.-S. Pierre, "A Novel Rate Model of Temperature-Dependent Development for Arthropods," Environmental Entomology, 28(1), 1999 pp. 22–29. doi:10.1093/ee/28.1.22.
[4] L. Huang, C.-A. Hwang and J. Phillips, "Evaluating the Effect of Temperature on Microbial Growth Rate—The Ratkowski and a Bĕlehrádek-Type Models," Journal of Food Science, 76(8), 2011 pp. M547–M557. doi:10.1111/j.1750-3841.2011.02345.x.
[5] M. Peleg and M. G. Corradini, "Microbial Growth Curves: What the Models Tell Us and What They Cannot," Critical Reviews in Food Science and Nutrition, 51(10), 2011 pp. 917–945. doi:10.1080/10408398.2011.570463.
Permanent Citation
 Uncertainties in Isothermal Microbial Growth
Mark D. Normand and Micha Peleg Model of Microbial Nutrient Uptake
Elena Beltrán-Heredia Ratkowski's Square Root Growth Rate Model for High Temperatures
Mark D. Normand and Micha Peleg Square Root Model for Rates of Microbial Growth or Inactivation
Mark D. Normand and Micha Peleg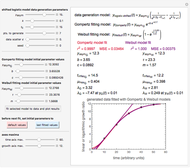 Lag Time in Microbial Growth
Mark D. Normand and Micha Peleg Stochastic Model of Microbial Injury and Mortality
Mark D. Normand , Maria G. Corradini, and Micha Peleg Probabilistic Model for Microbial Mortality
Mark D. Normand and Micha Peleg Probabilistic Model Showing Sigmoid Semilogarithmic Survival
Mark D. Normand, Micha Peleg, and Zack J. Rosenthal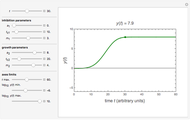 Growth Inhibition and Retardation by Antimicrobials
Mark D. Normand and Micha Peleg Weibullian versus Log-Linear Microbial Survival Models
Mark D. Normand and Micha Peleg
-
Ratkowski's Square Root Growth Rate Model for High Temperatures
Micha Peleg -
 Gordon-Taylor and Fox Equations for Glass Transition Temperature
Micha Peleg -
 Force to Overcome Vacuum Pull
Micha Peleg -
 Extending the Square Root Growth Rate Model to Lethal Low Temperatures
Micha Peleg -
 Probability of Being Strange According to Paulos
Micha Peleg -
 Successive Three-Point Method for Weibullian Chemical Degradation
Micha Peleg -
 Estimating Cohesion and Tensile Strength of Compacted Powders
Micha Peleg -
 Three-Endpoints Method for Isothermal Weibullian Chemical Degradation
Micha Peleg -
 Vitamin C Loss in Foods During Heat Processing and Storage
Micha Peleg -
 Parameterizing Temperature-Viscosity Relations
Micha Peleg -
 Laplace Distribution in Fluctuating Stock Index Records
Micha Peleg -
 Weibullian Chemical Degradation
Micha Peleg -
 Simulating Ascorbic Acid Degradation
Micha Peleg -
 Additive and Multiplicative Risks
Micha Peleg -
 Endpoints Method for Predicting Chemical Degradation in Frozen Foods
Micha Peleg -
 Exponential Model for Arrhenius Activation Energy
Micha Peleg -
 Prediction of Isothermal Degradation by the Endpoints Method
Micha Peleg -
 Risk Guesstimation from Factor Ranges
Micha Peleg -
 Volatiles Formation Kinetics in Stored Fish
Micha Peleg -
 Comparison of Six Sigmoid Growth Curve Models
Micha Peleg