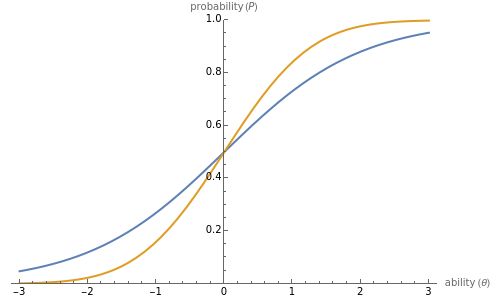
Comparing the Normal Ogive and Logistic Item Characteristic Curves

Requires a Wolfram Notebook System
Interact on desktop, mobile and cloud with the free Wolfram Player or other Wolfram Language products.
In item response theory, the relationship between a latent ability ( ) and the probability of a correct response (
 ) on a test item is modelled by an item characteristic curve. This Demonstration plots the item characteristic curve of a single dichotomous item under two different models: the normal ogive model and the logistic model. The parameters
  ,
,  , and
, and  represent item properties related to discrimination, difficulty, and guessing. The constant
  is used to scale the logistic curve. Notice that the two curves are nearly identical when
  .
.
Contributed by: Vincent Kieftenbeld (March 2011)
Open content licensed under CC BY-NC-SA
Snapshots
Details
The probability that a person with ability level  gives a correct response (
 ) to an item with discrimination parameter
  , difficulty parameter
  , and pseudo-guessing parameter
  is modelled in the normal ogive model as
 .
.
Alternatively, in the three-parameter logistic model,
 .
.
The constant D is used to scale the logistic curve and represents the relationship between logits and probits. When  , the models agree closely; that is, 1 logit is approximately equal to 1.7 probit. In fact,
  minimizes the maximum difference between the normal ogive and logistic curves.
Reference:
G. Camilli, "Origin of the Scaling Constant d=1.7 in Item Response Theory," Journal of Educational and Behavioral Statistics, 19(3), 1994 pp. 293–295.
Permanent Citation


