Hidden Correlation in Regression


Requires a Wolfram Notebook System
Interact on desktop, mobile and cloud with the free Wolfram Player or other Wolfram Language products.
This Demonstration simulates the linear regression  ,
,  , where
  ,
,  , and the
  are random independent variables from a continuous uniform distribution on
  ;
;  is generated from a multivariate normal distribution with mean vector 0 and covariance matrix
  , where
  and
and  ,
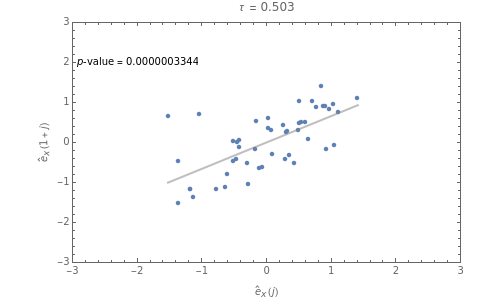
,  . The thumbnail shows the Poincaré plot (or scatterplot) of the lagged reordered residuals
  versus
  from the linear model fit. The Kendall rank correlation and its two-sided
  -value shown in the plot provide a diagnostic test for the presence of hidden correlation. From this residual plot, we clearly see that the errors violate the usual regression assumption of independence. This model misspecification is less obvious using the traditional residual dependency plot.
Contributed by: Ian McLeod and Yun Shi (March 2013)
Department of Statistical and Actuarial Sciences, Western University
Open content licensed under CC BY-NC-SA
Snapshots

Details
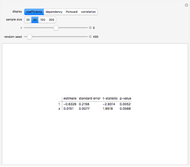
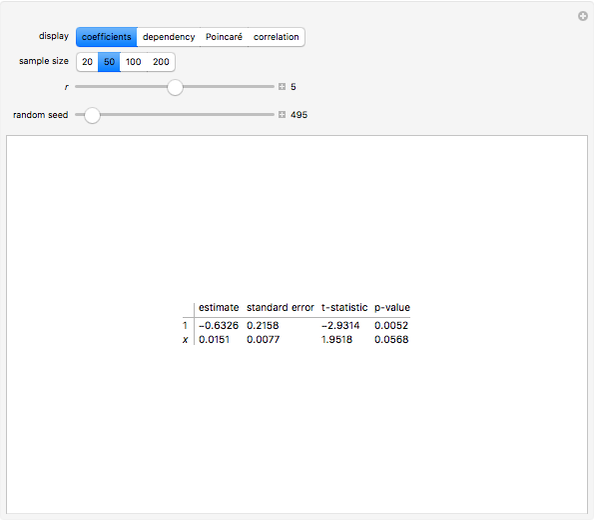
Snapshot 1: The parameter estimates, their standard errors, and -values in the fitted regression with true parameters are shown. Due to model misspecification, the standard errors are too small, and the -values falsely suggest the coefficient  is nonzero while the estimate for
  with a -value of about 6% is borderline.
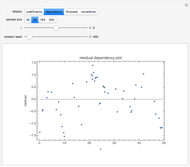
Snapshot 2: The residual dependency plot is flat, suggesting model adequacy. Looking at this plot more carefully, we do see a nonrandom pattern, but it is less evident than in the Poincaré plot.
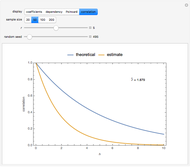
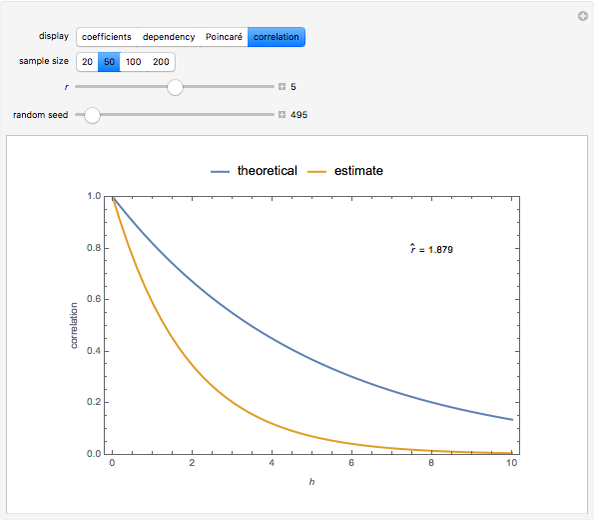
Snapshot 3: Comparison of the estimated and theoretical correlation functions. The parameter  is estimated by nonlinear least squares.
Snapshot 4-6: In the next 3 shapshots,  and the other settings remain the same. In this case the effect of model misspecification increases and is again detected better in the Poincaré plot than in the residual dependency plot. Both regression parameters are erroneously reported as very significant.
Residual dependency plots for checking regression fits are discussed in most regression textbooks as for example ([1, 2]).
Lagged scatterplots are sometimes called Poincaré plots ([3, 4]).
See [5] for further discussion of hidden correlation in regression.
References
[1] W. S. Cleveland, Visualizing Data. Summit, NJ: Hobart Press, 1993.
[2] S. J. Sheather, A Modern Approach to Regression with R, New York: Springer, 2009.
[3] D. Kaplan and L. Glass, Understanding Nonlinear Dynamics, New York: Springer, 1995.
[4] Wikipedia. "Poincaré plot." (Mar 20, 2013). en.wikipedia.org/wiki/Poincare_plot.
[5] E. Mahdi. Diagnostic Checking, Time Series and Regression, Ph.D Thesis, Western University, http://ir.lib.uwo.ca/etd/244.
Permanent Citation
 Regression toward the Mean
Ian McLeod Karhunen-Loeve Directions and Regression
Ian McLeod Line Plots, Histograms, and Stem-and-Leaf Plots
Sarah Lichtblau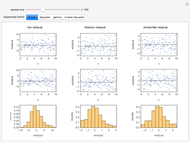 Comparing Some Residuals for Generalized Linear Models
Darren Glosemeyer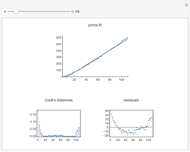 Fitting Primes to a Linear Model
Darren Glosemeyer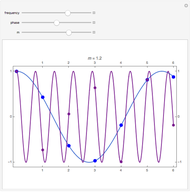 Aliasing in Time Series Analysis
Ian McLeod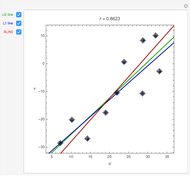 Correlation and Regression Explorer
Ian McLeod (The University of Western Ontario)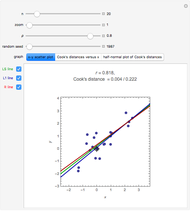 Influential Points in Regression
Ian McLeod Spread-Location Regression Diagnostic Check
Ian McLeod Mean, Fitted-Value, Error, and Residual in Simple Linear Regression
Ian McLeod
