Mean, Fitted-Value, Error, and Residual in Simple Linear Regression


Requires a Wolfram Notebook System
Interact on desktop, mobile and cloud with the free Wolfram Player or other Wolfram Language products.
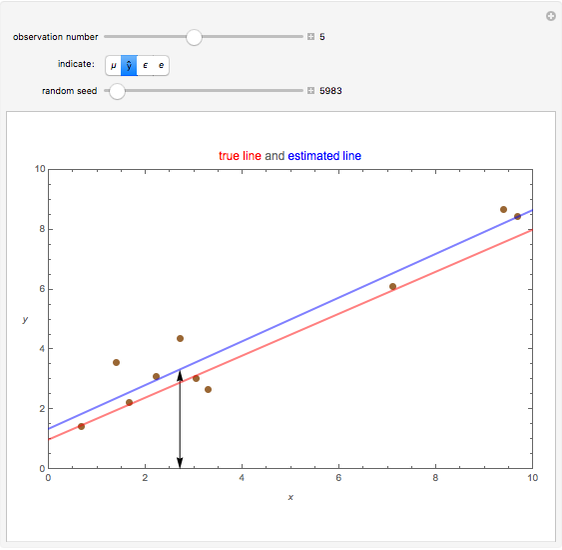
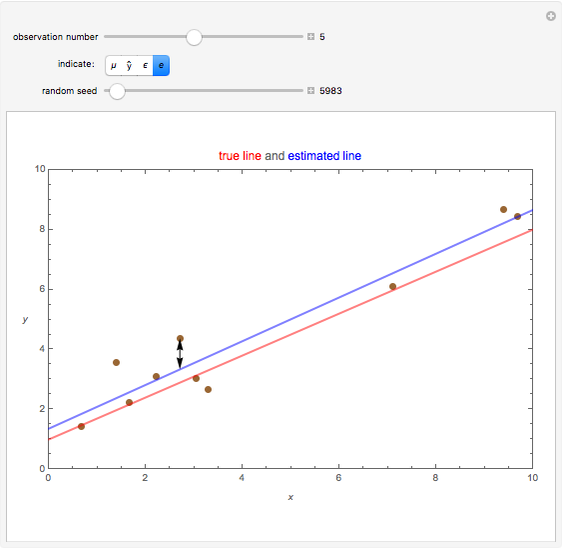
This Demonstration simulates the simple linear regression  ,
,  . The red line is the plot of
  , while the blue line is the plot of
  , where
  and
and  are the least-squares estimates. The
  's are ordered from smallest to largest and for any particular observation number
  that is selected, a double arrow is used to indicate
  ,
,  ,
,  , or
, or  . In the thumbnail,
  has been selected with
  , so the double arrow shows the value of
  . The numerical values of these quantities are displayed when you mouseover one of the data points. Select some other observation numbers. Can you give approximate values for the quantities shown by the arrows? Check your answer by mousing over the selected observation.
Contributed by: Ian McLeod (September 2013)
(Department of Statistical and Actuarial Sciences, Western University)
Open content licensed under CC BY-NC-SA
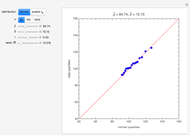
Snapshots

Details
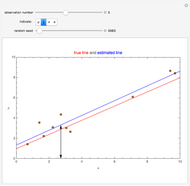
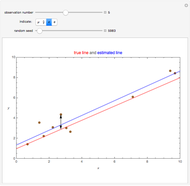
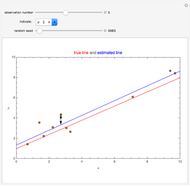
Snapshots 1, 2, and 3 show the fitted value, error, and residual, respectively, for the selected observation.
Permanent Citation
"Mean, Fitted-Value, Error, and Residual in Simple Linear Regression"
http://demonstrations.wolfram.com/MeanFittedValueErrorAndResidualInSimpleLinearRegression/
Wolfram Demonstrations Project
Published: September 26 2013
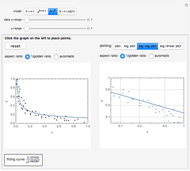 Interactive Curve Fitting
Janos Karsai (University of Szeged, Hungary)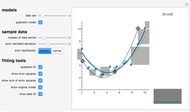 Linear and Quadratic Curve Fitting Practice
Jon McLoone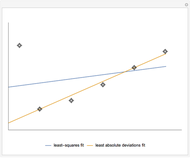 Comparing Least-Squares Fit and Least Absolute Deviations Fit
Frank Brechtefeld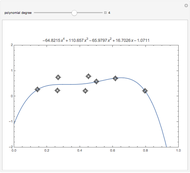 Curve Fitting
Theodore Gray Fitting an Elephant
Roger J. Brown Fitting Noisy Data
Rob Morris Kernel Density Estimation
Jeff Hamrick Multidimensional Scaling
Yaroslav Bulatov Regression toward the Mean
Ian McLeod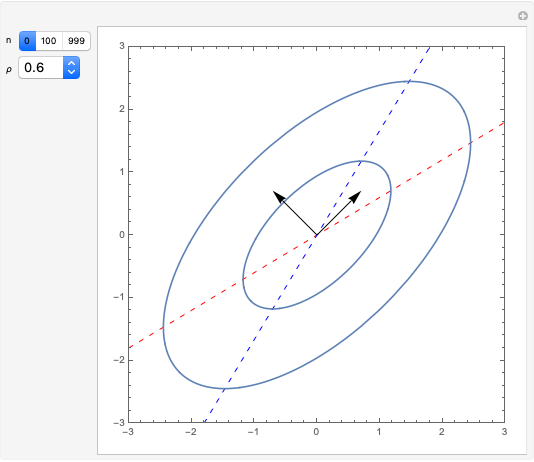 Karhunen-Loeve Directions and Regression
Ian McLeod
-
 Rank Transform in Harmonic Regression Time Series
Ian McLeod -
 Detecting Periodicity in Short Time Series
Ian McLeod -
 Tempered Fractionally Differenced White Noise
Ian McLeod -
Regression toward the Mean
Ian McLeod -
 Spread-Location Regression Diagnostic Check
Ian McLeod -
 Anscombe Quartet
Ian McLeod -
 Visualizing Higher-Dimensional Data with 3D Scatterplots
Ian McLeod -
 Mean, Fitted-Value, Error, and Residual in Simple Linear Regression
Ian McLeod -
 Estimating and Diagnostic Checking in Censored Normal Random Samples
Ian McLeod -
 Comparing Gamma and Log-Normal Distributions
Ian McLeod -
 Monte Carlo Expectation-Maximization (EM) Algorithm
Ian McLeod -
 Comparing Exact and Approximate Censored Normal Likelihoods
Ian McLeod -
 Transformation to Symmetry of Gamma Random Variables
Ian McLeod -
 Illustrating the Central Limit Theorem with Sums of Bernoulli Random Variables
Ian McLeod -
 Hidden Correlation in Regression
Ian McLeod -
 Informal Power Assessment of the Normal Probability Plot
Ian McLeod -
 Time Series for Power-Law Decay
Ian McLeod -
 Block Bootstrap for Time Series
Ian McLeod -
 Fractional Gaussian Noise
Ian McLeod -
 Plotting a Long Time Series
Ian McLeod