Simulating the M/M/1 Queue

Requires a Wolfram Notebook System
Interact on desktop, mobile and cloud with the free Wolfram Player or other Wolfram Language products.
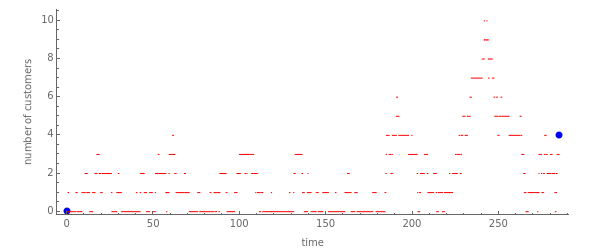
This Demonstration shows simulated paths of the M/M/1 queue. Thus, you can see how the number of customers changes with time. You can adjust the initial number of customers, the mean time between arrivals, and the mean service time. The M/M/1 queue is an example of a continuous-time Markov chain.
Contributed by: Heikki Ruskeepää (March 2011)
Open content licensed under CC BY-NC-SA
Snapshots
Details
Snapshot 1: steady-state situation: the number of customers stays moderate
Snapshot 2: unsteady state: the number of customers has a growing trend
Snapshot 3: the number of customers reaches the value 200
In snapshot 1, the mean service time (2) is smaller than the mean time between arrivals (3). We have a steady-state situation with mean number of customers being 2 and mean time in the system being 6. The server works two-thirds of the time.
In snapshot 2, the mean service time (4) is larger than the mean time between arrivals (3). We have an unsteady state and the number of customers in the system has a growing trend.
In snapshot 3, the number of customers reaches the value 200. The Demonstration only works properly if the number of customers stays below 200. If the number of customers reaches the value 200, the simulation does not allow the population to grow further.
The Demonstration only shows the first 200 steps (arrivals or departures of customers) of the process.
Recall that in an M/M/1 process, the time between arrivals of customers has an exponential distribution. The service time has another exponential distribution. With two of the sliders, you can adjust the means of these distributions. The service station only has a single server.
For the M/M/1 queue, see [1, pp. 262–269]. For simulation of the M/M/1 process and other stochastic processes with Mathematica, see [2, pp. 987–1002].
[1] A. O. Allen, Probability, Statistics, and Queueing Theory with Computer Science Applications, 2nd ed., Boston: Academic Press, 1990.
[2] H. Ruskeepää, Mathematica Navigator: Mathematics, Statistics, and Graphics, 3rd ed., San Diego, CA: Elsevier Academic Press, 2009.
Permanent Citation
"Simulating the M/M/1 Queue"
http://demonstrations.wolfram.com/SimulatingTheMM1Queue/
Wolfram Demonstrations Project
Published: March 7 2011


